Project Background
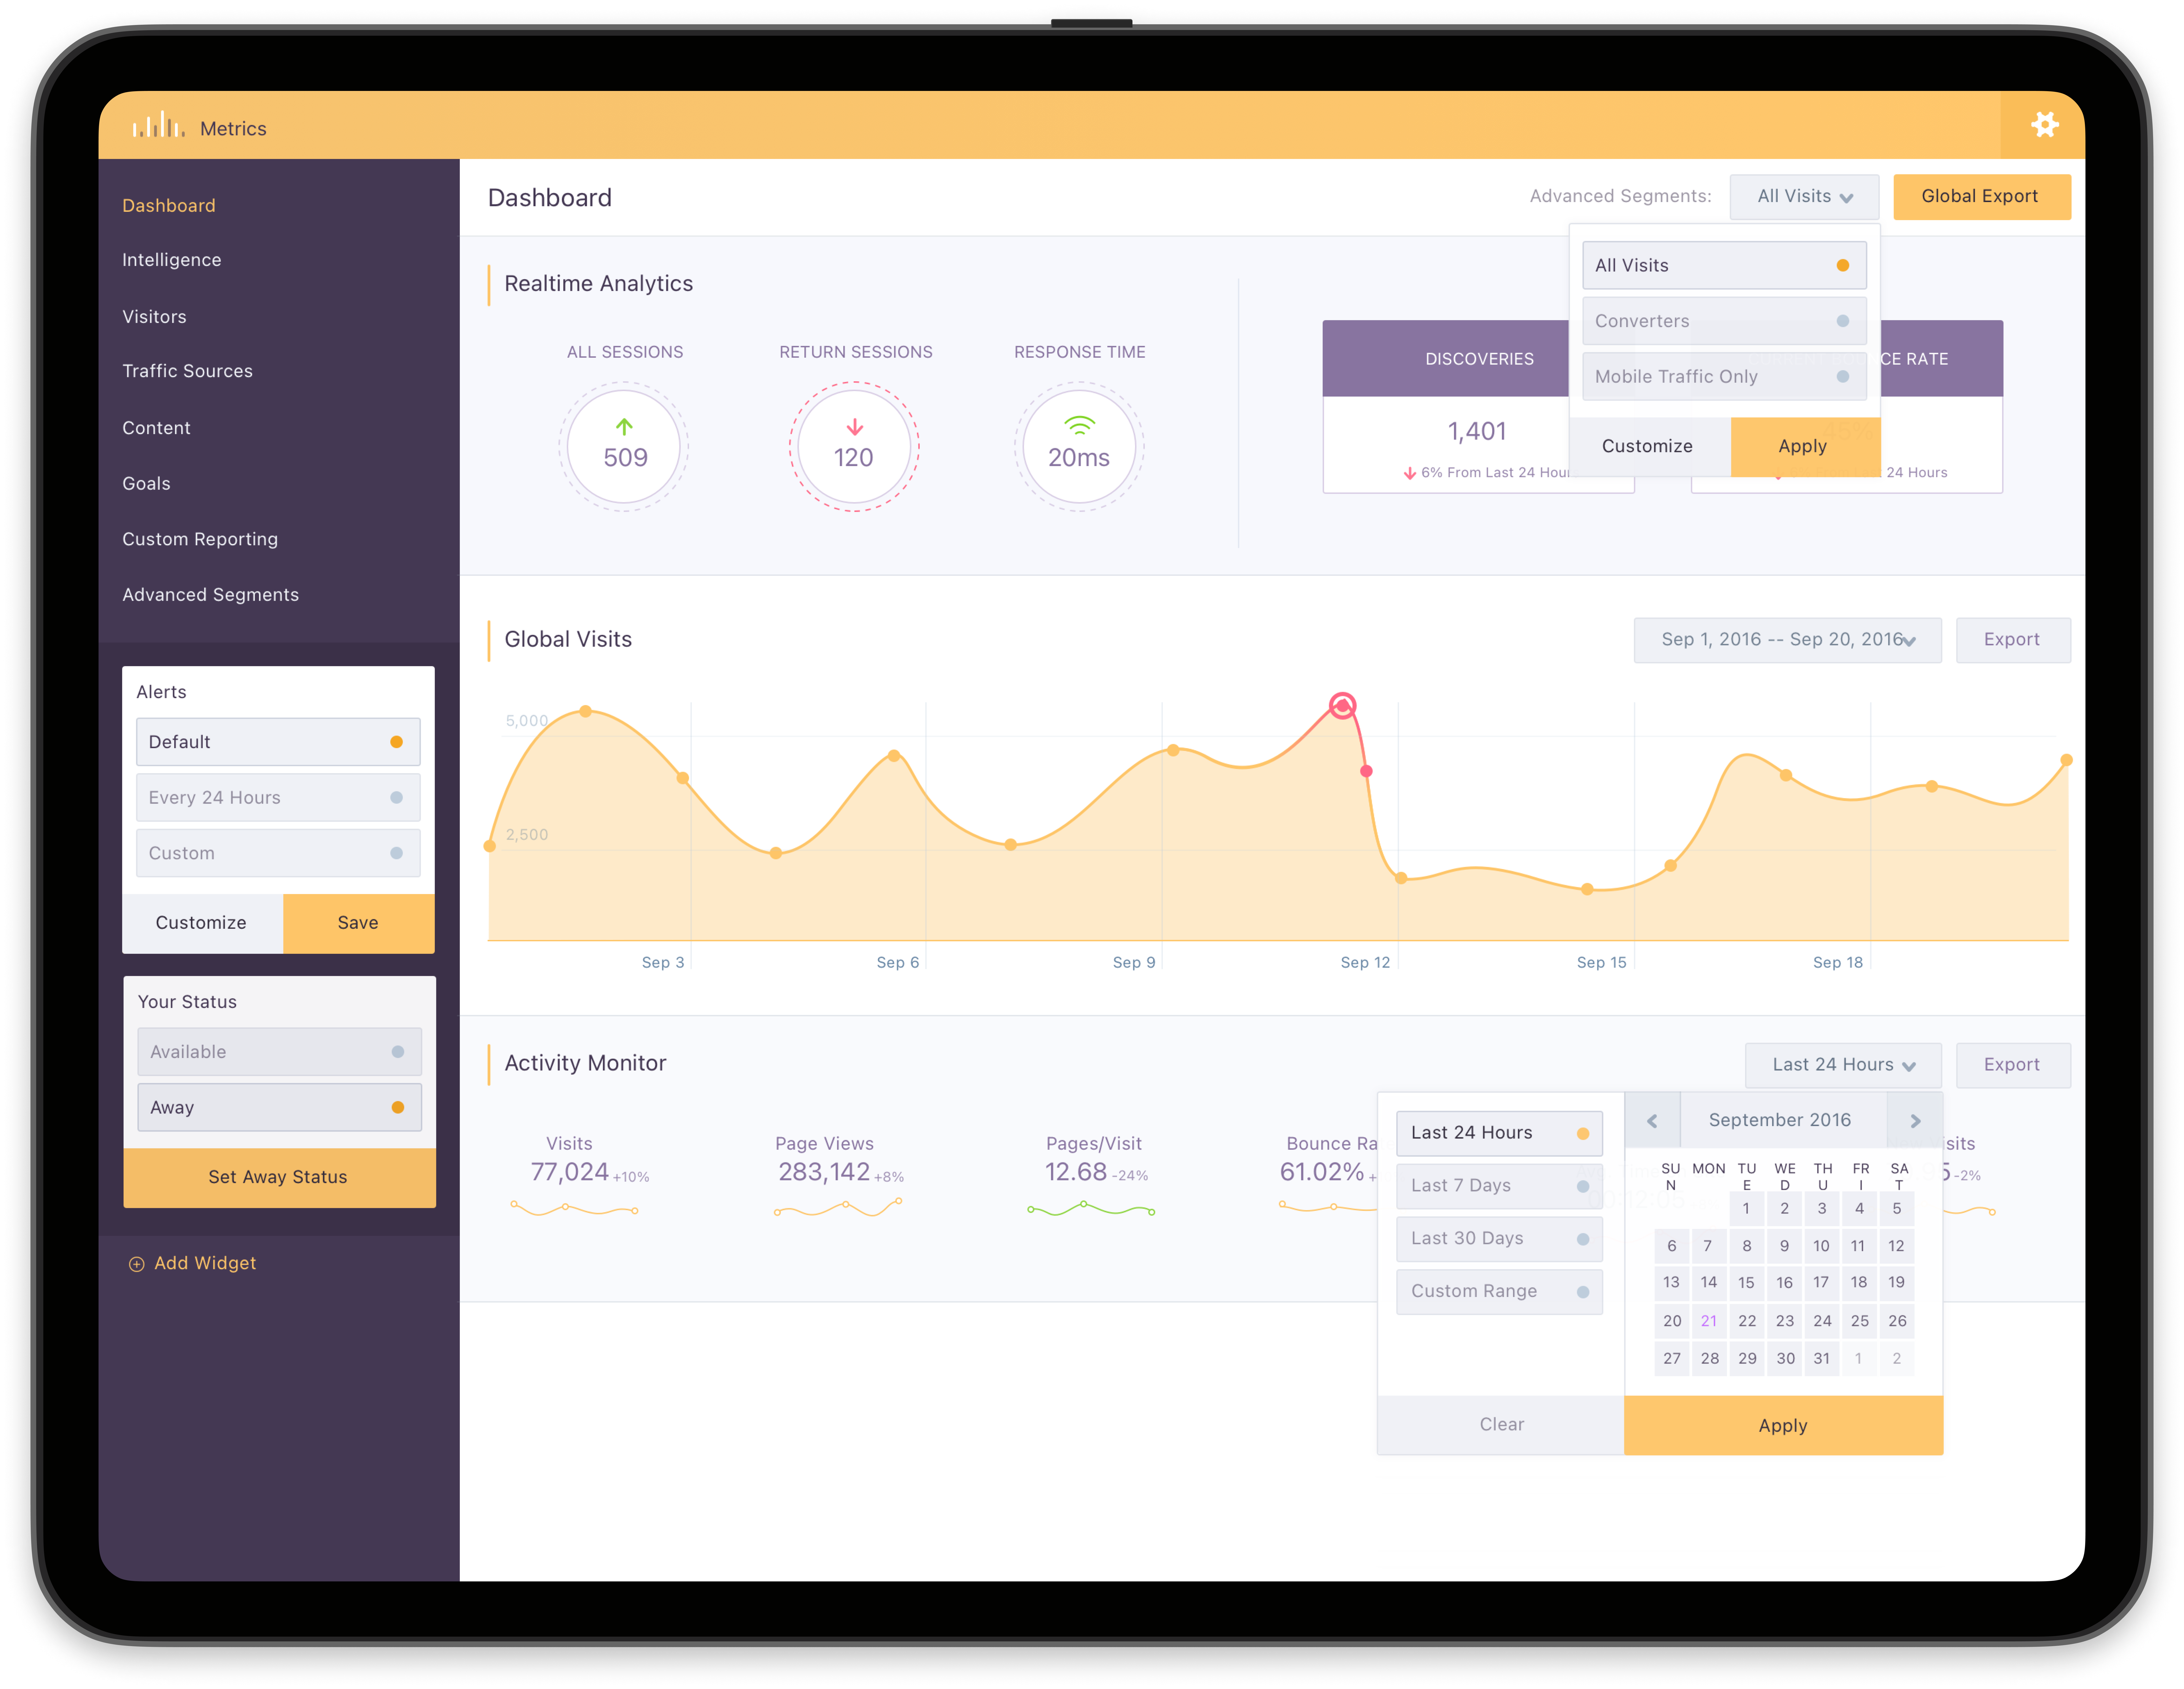
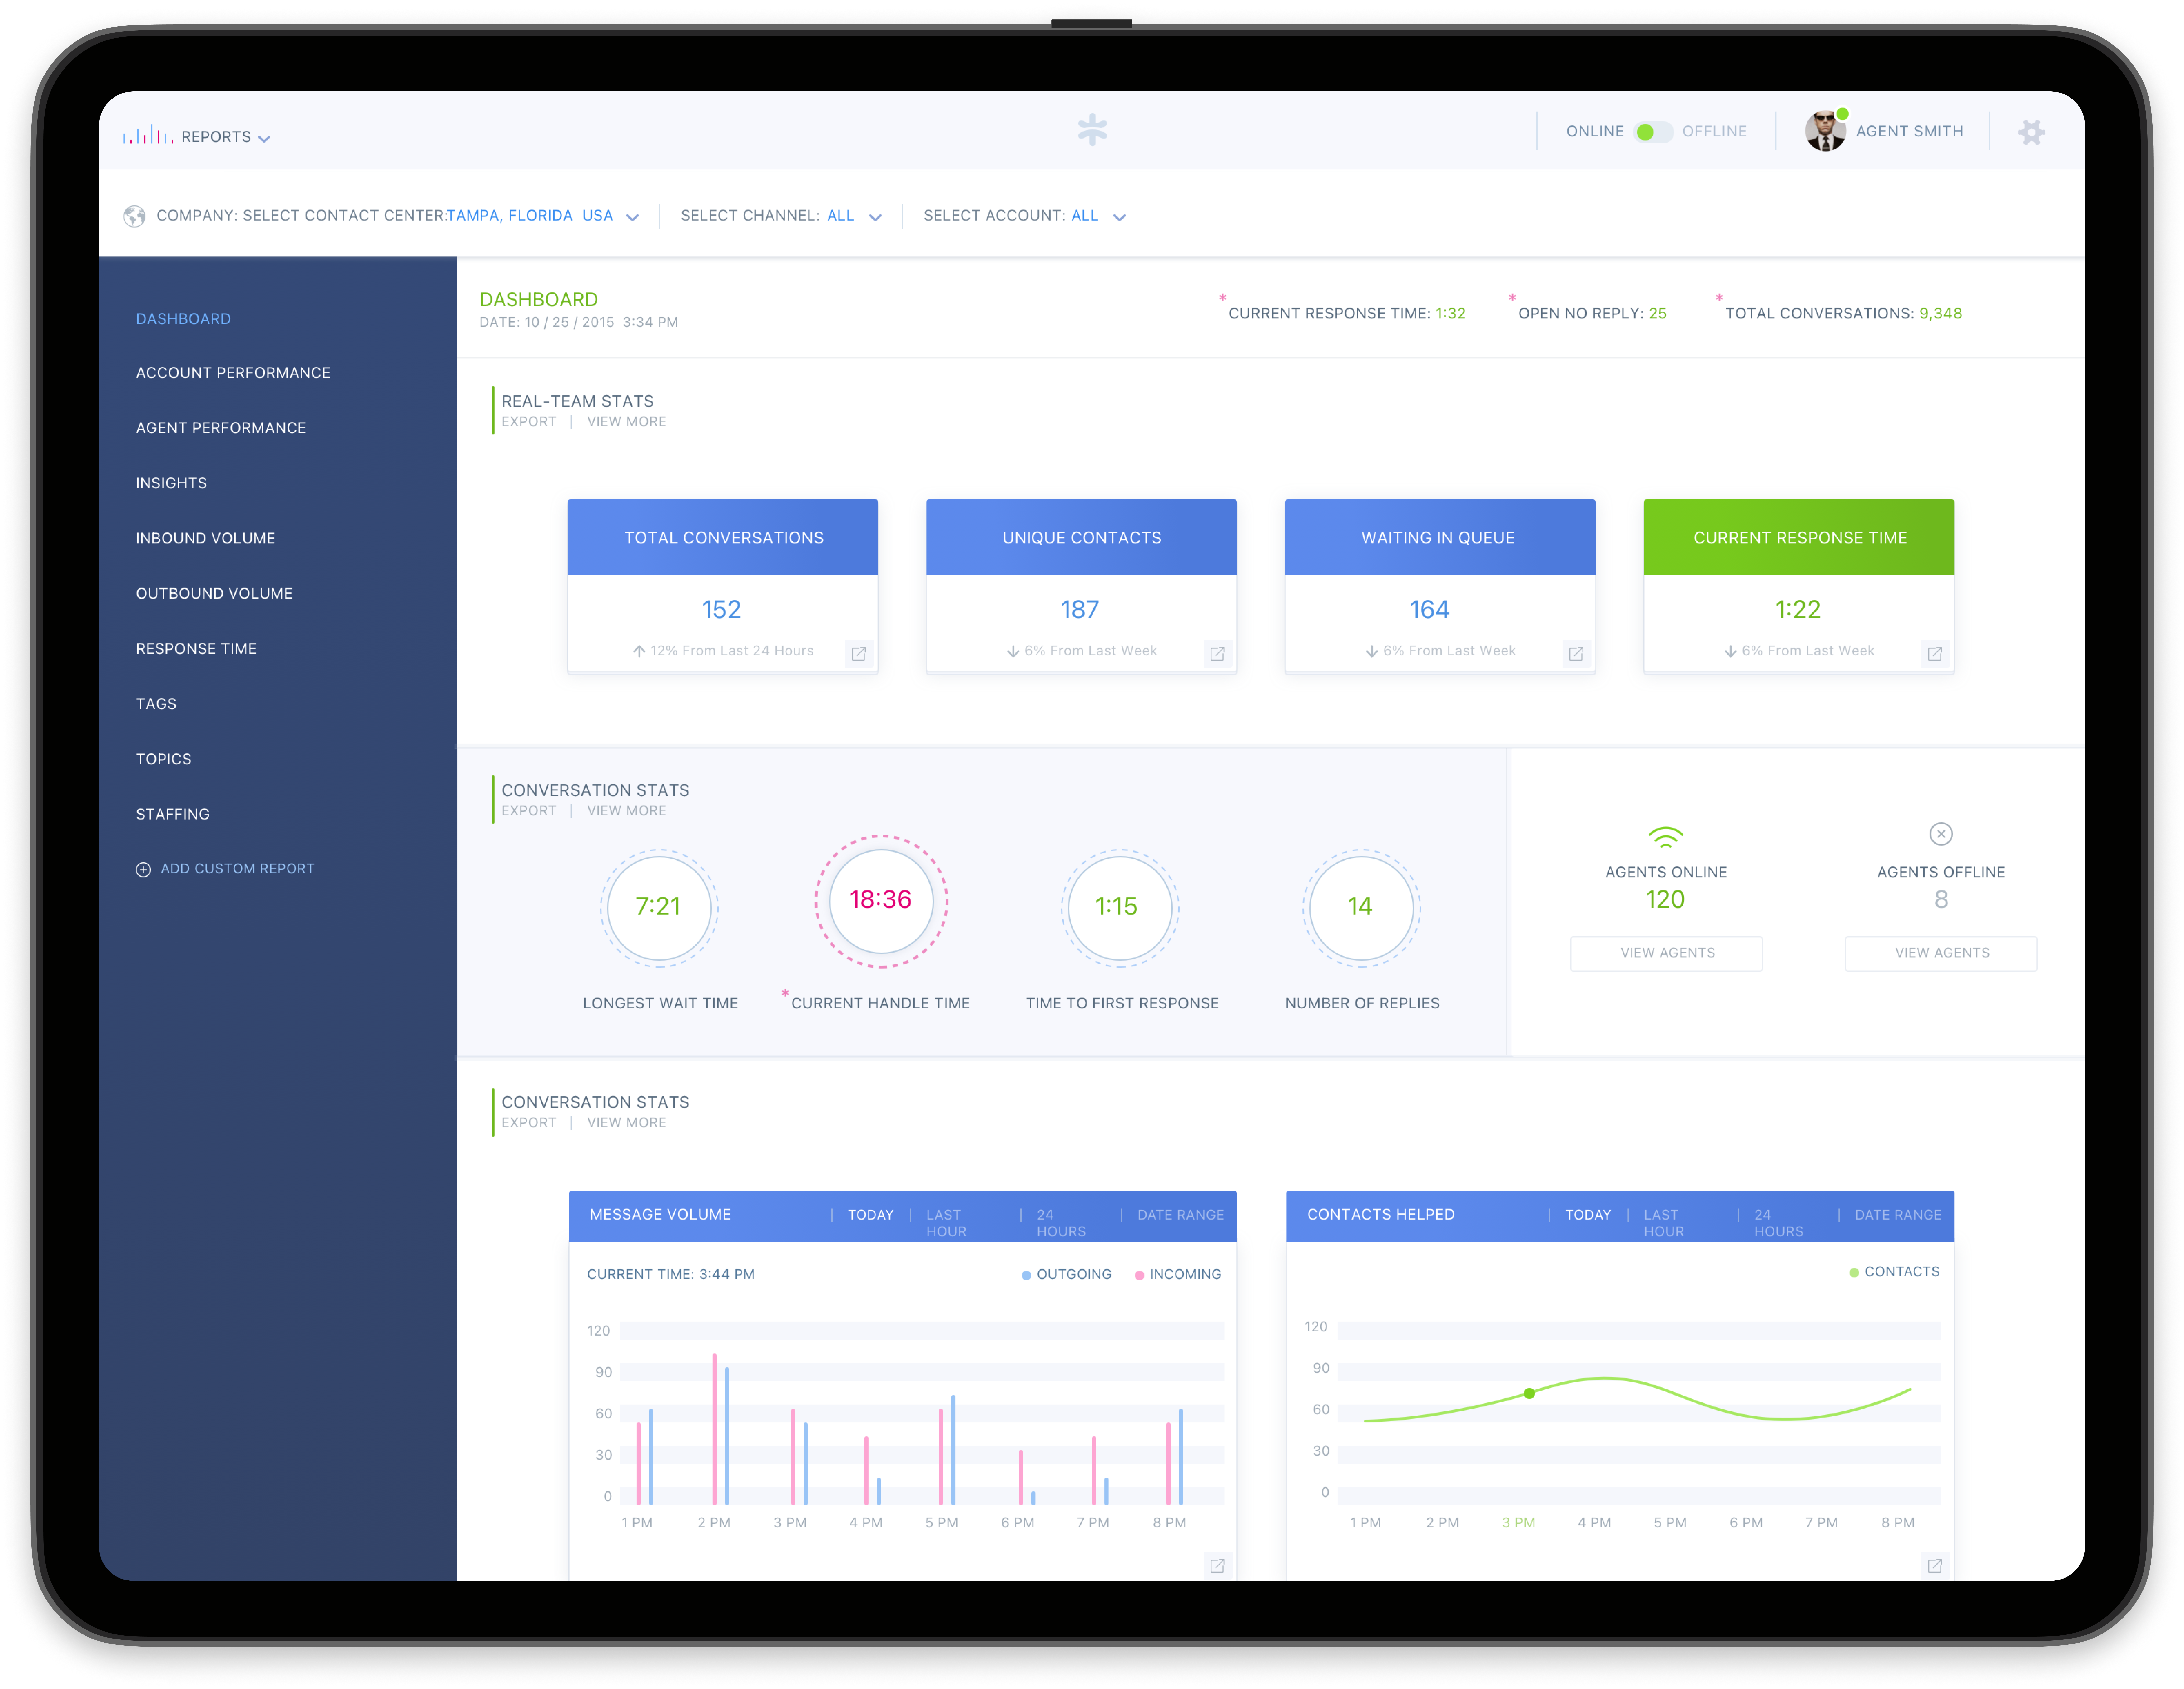
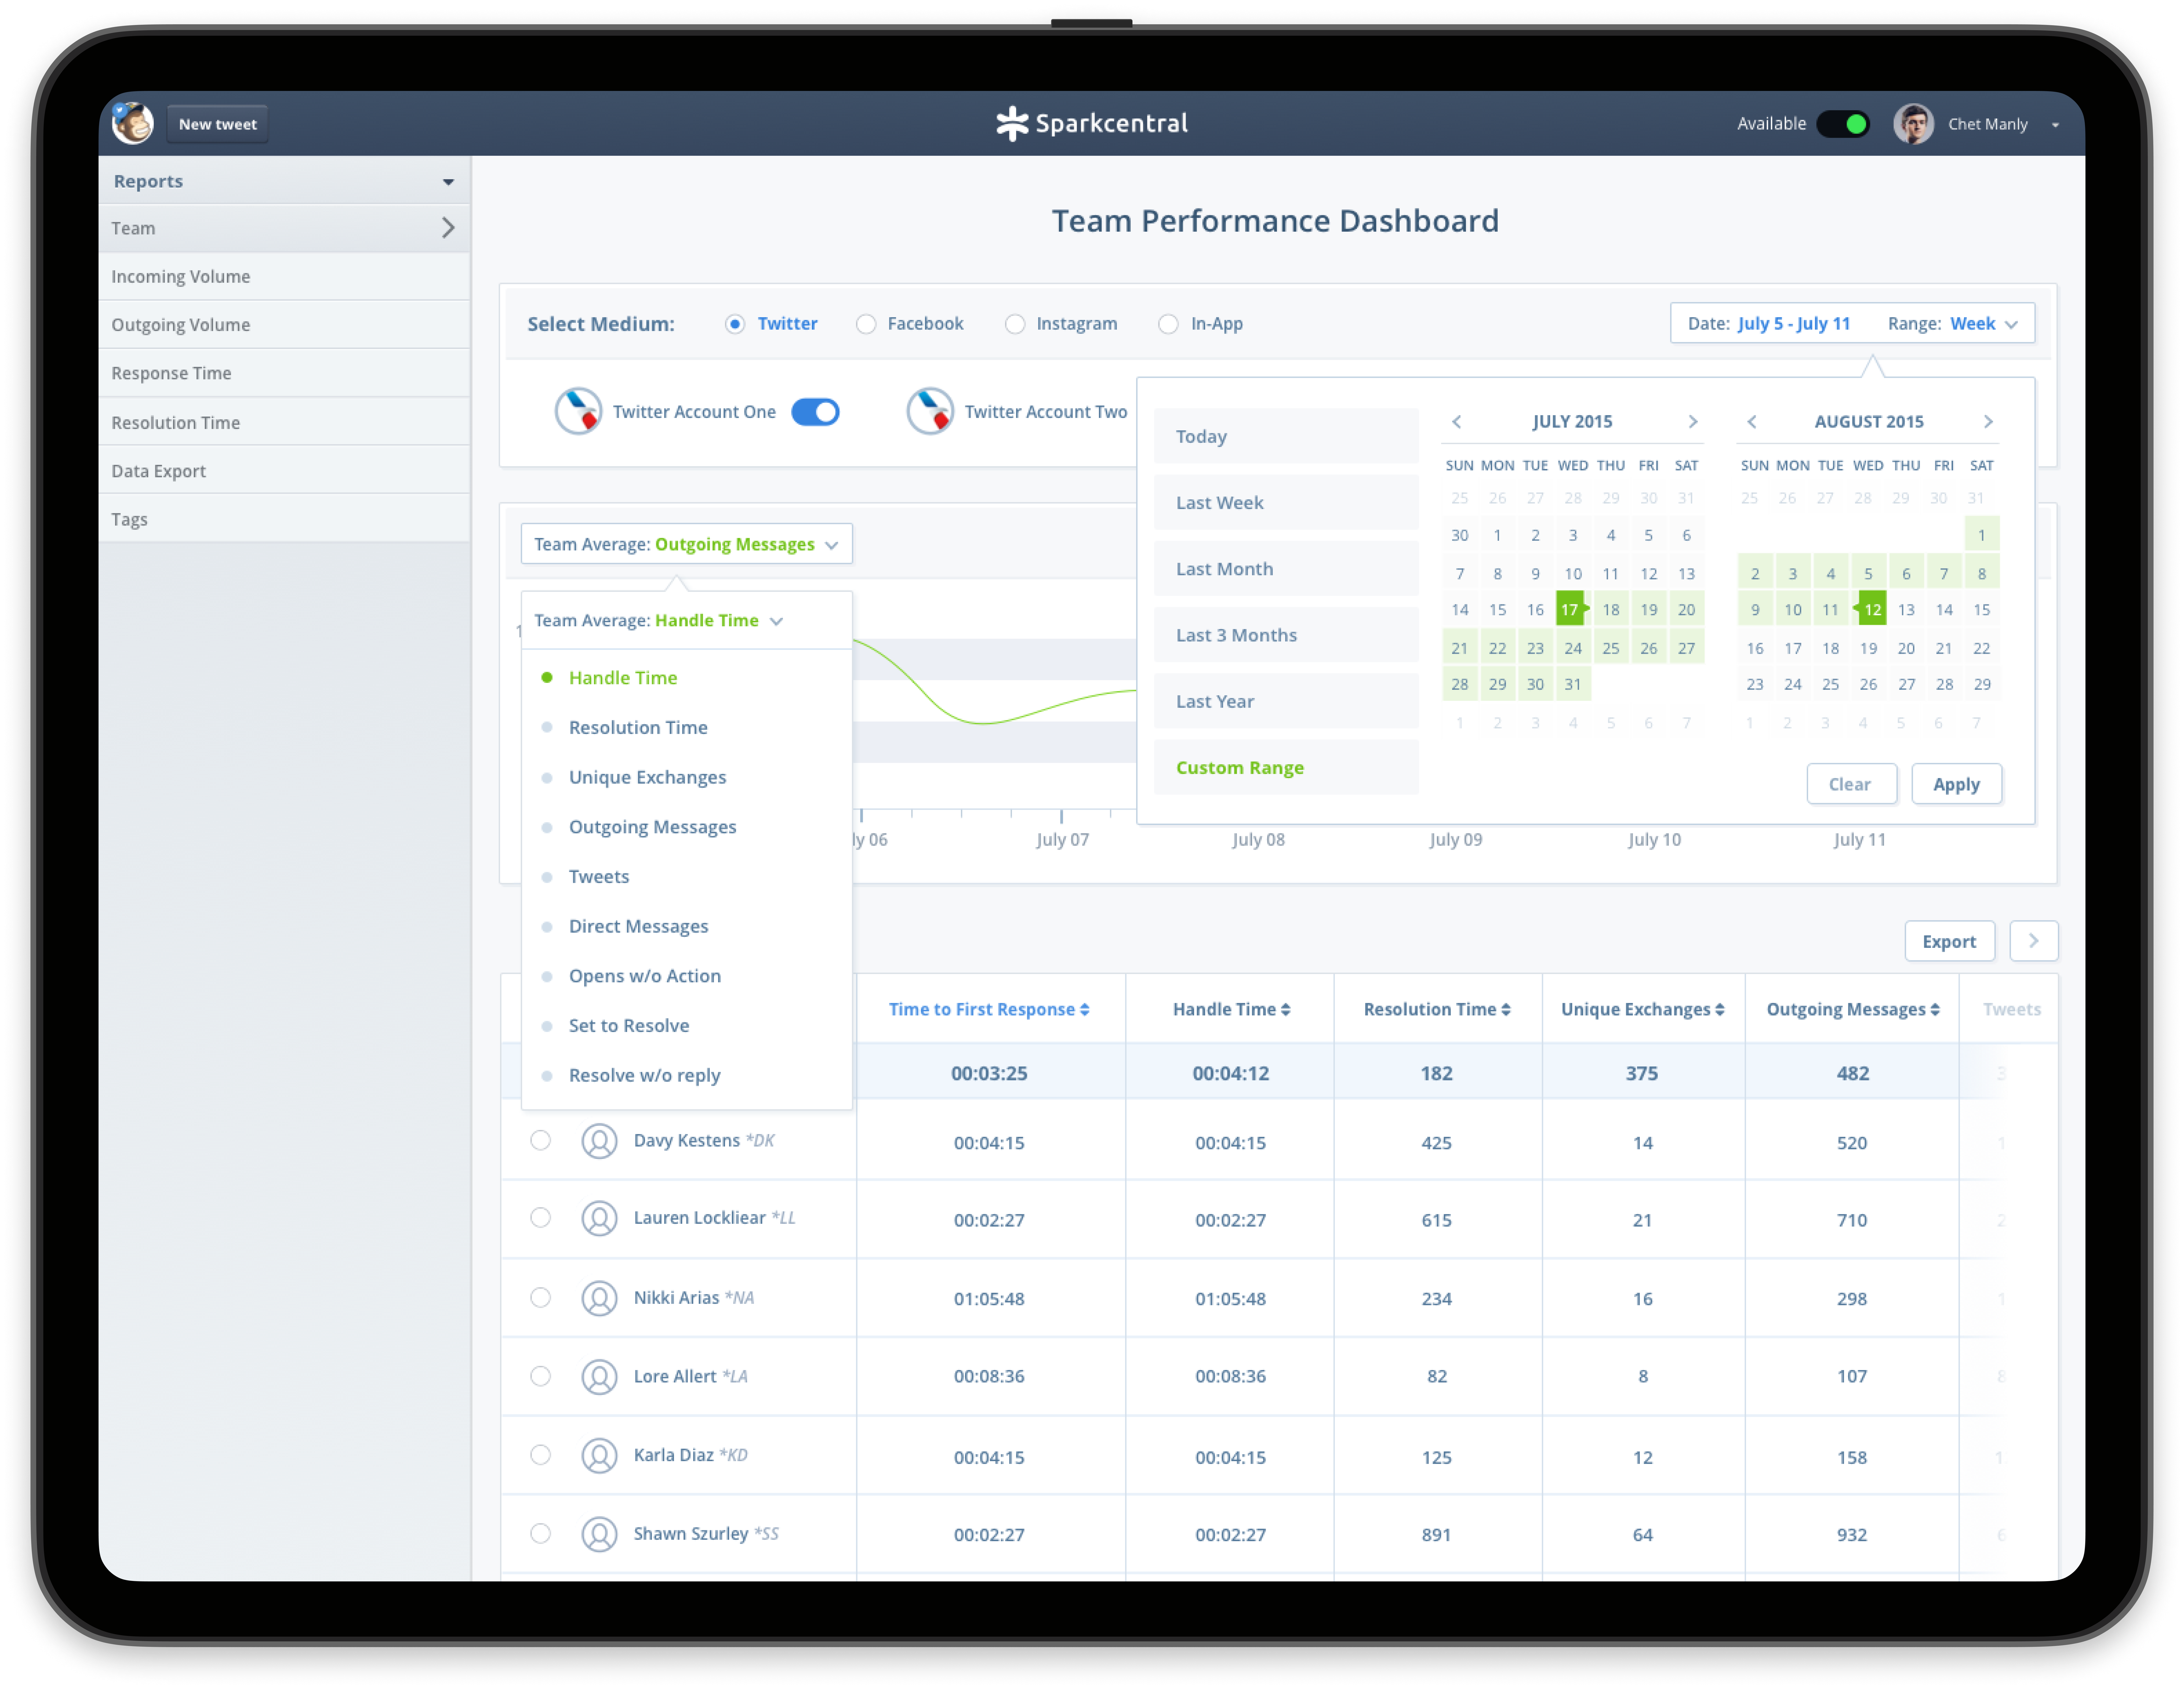
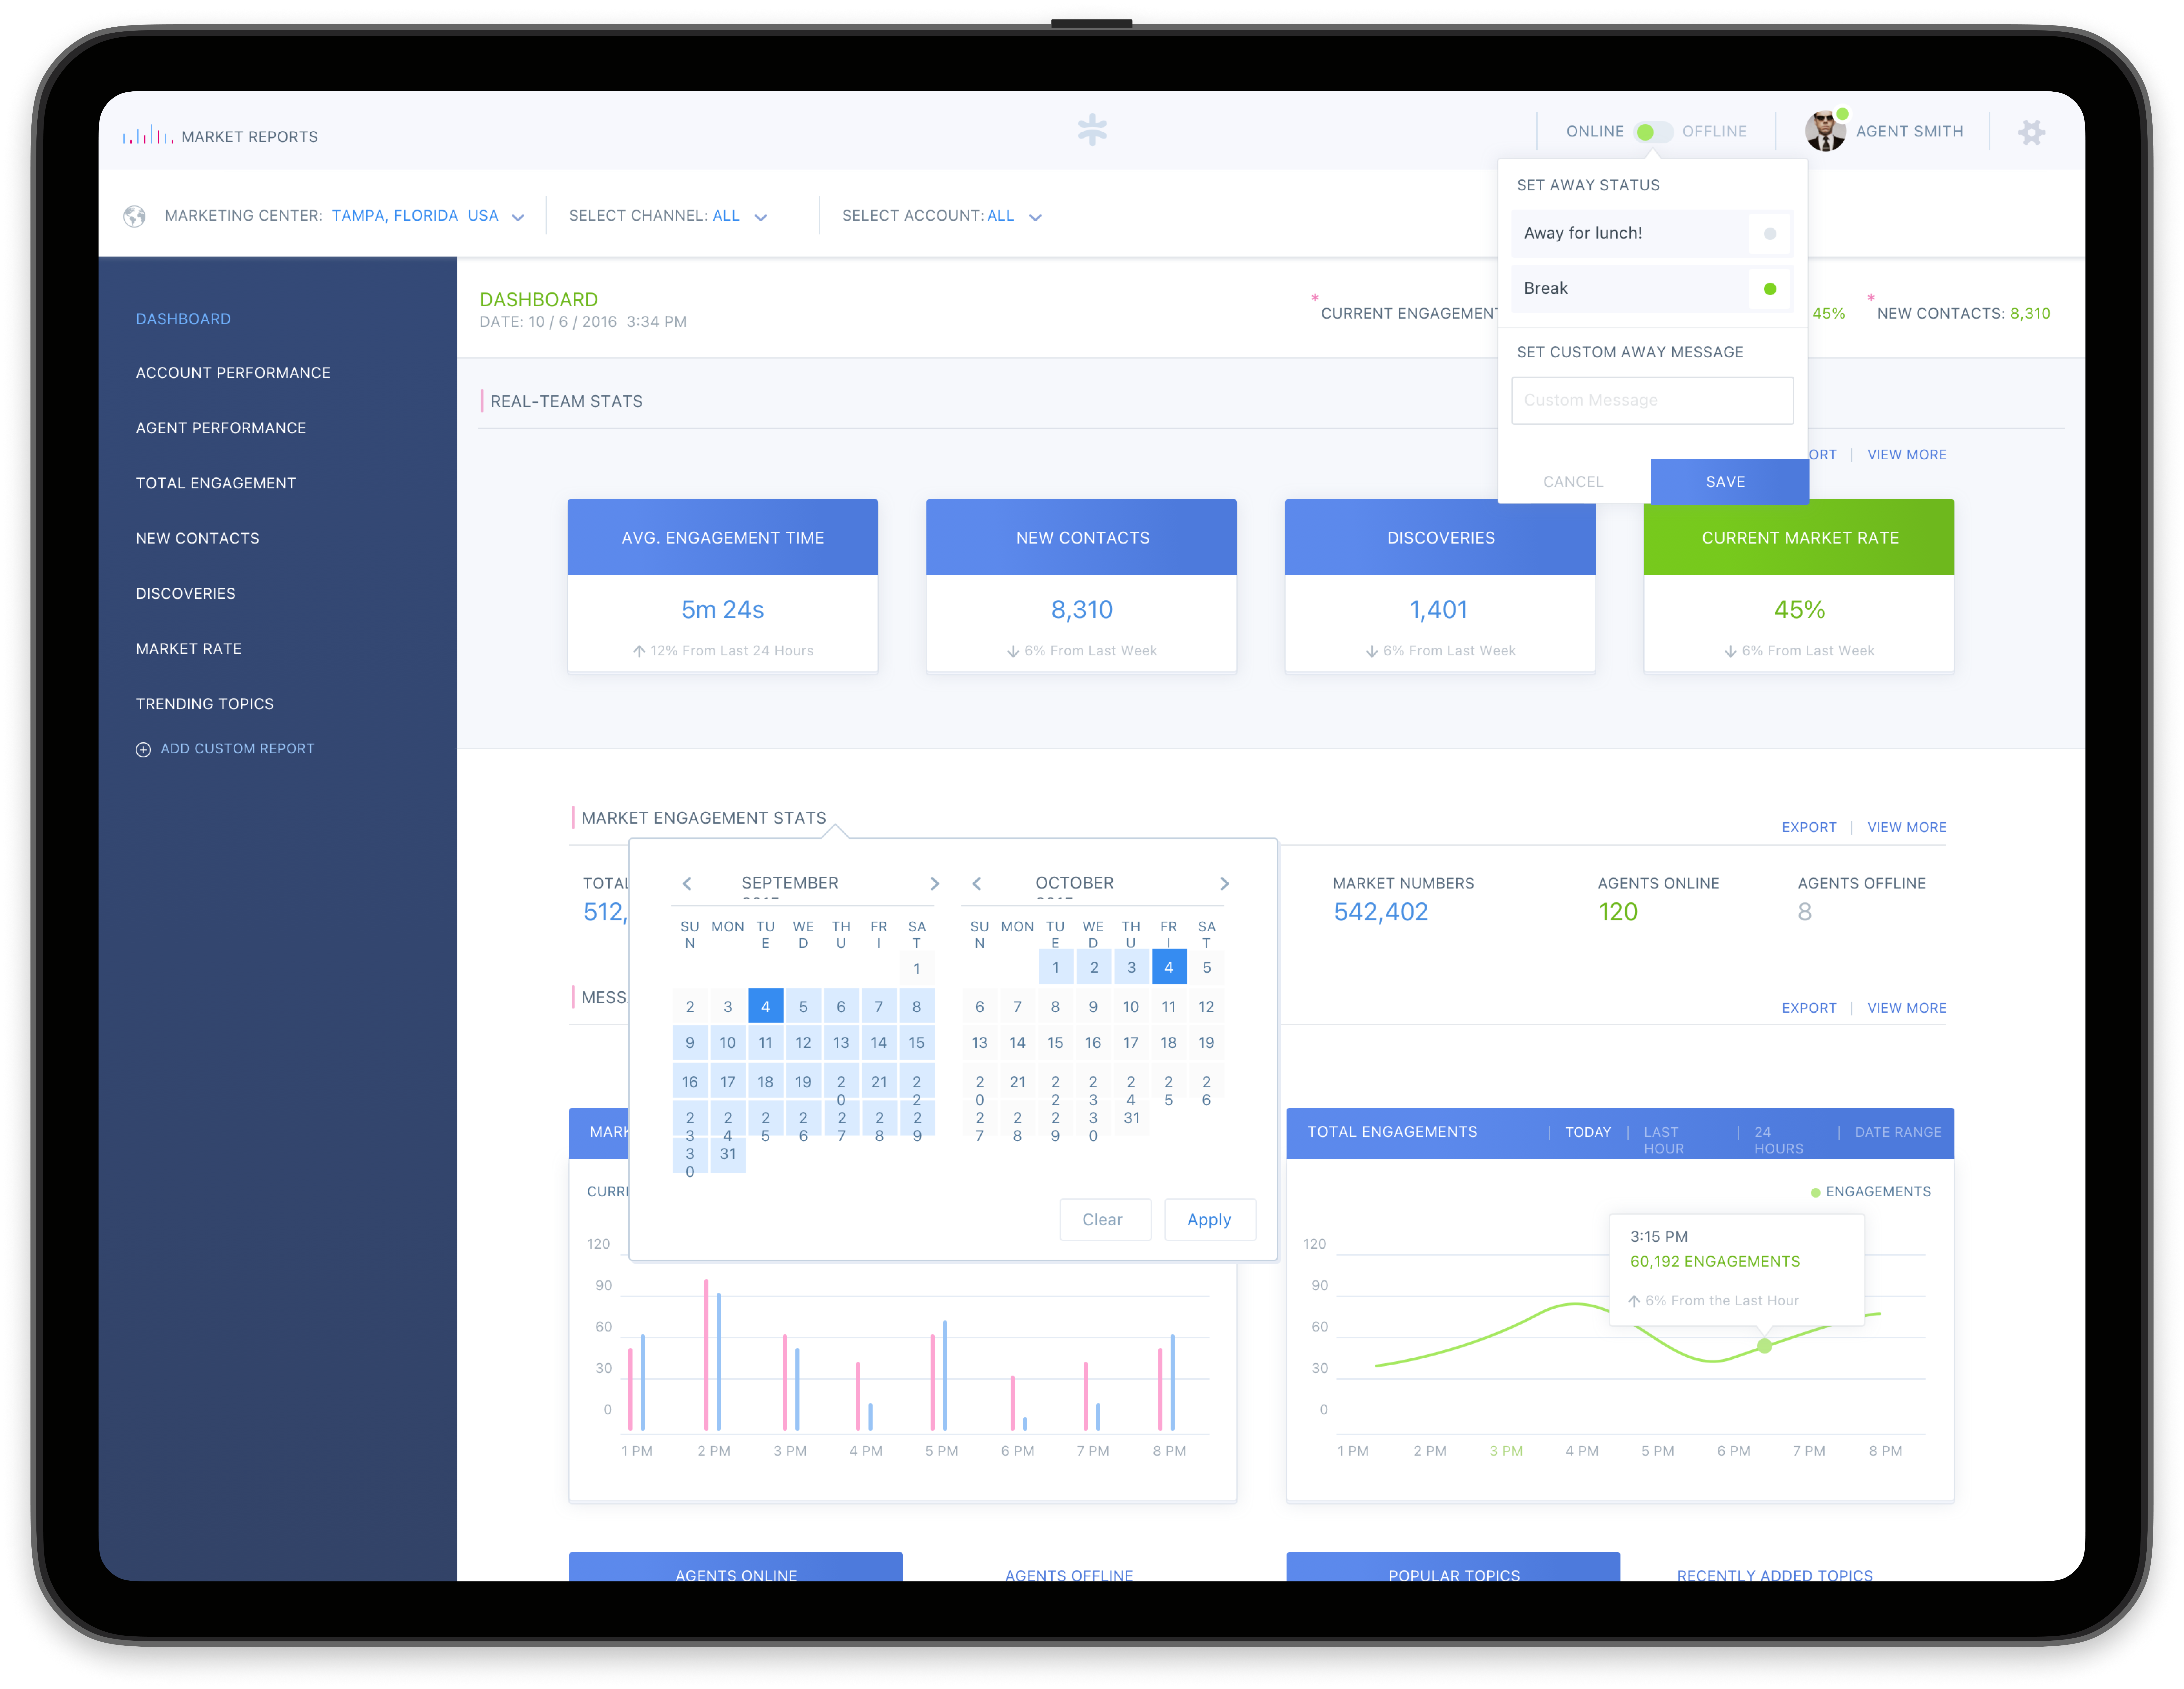
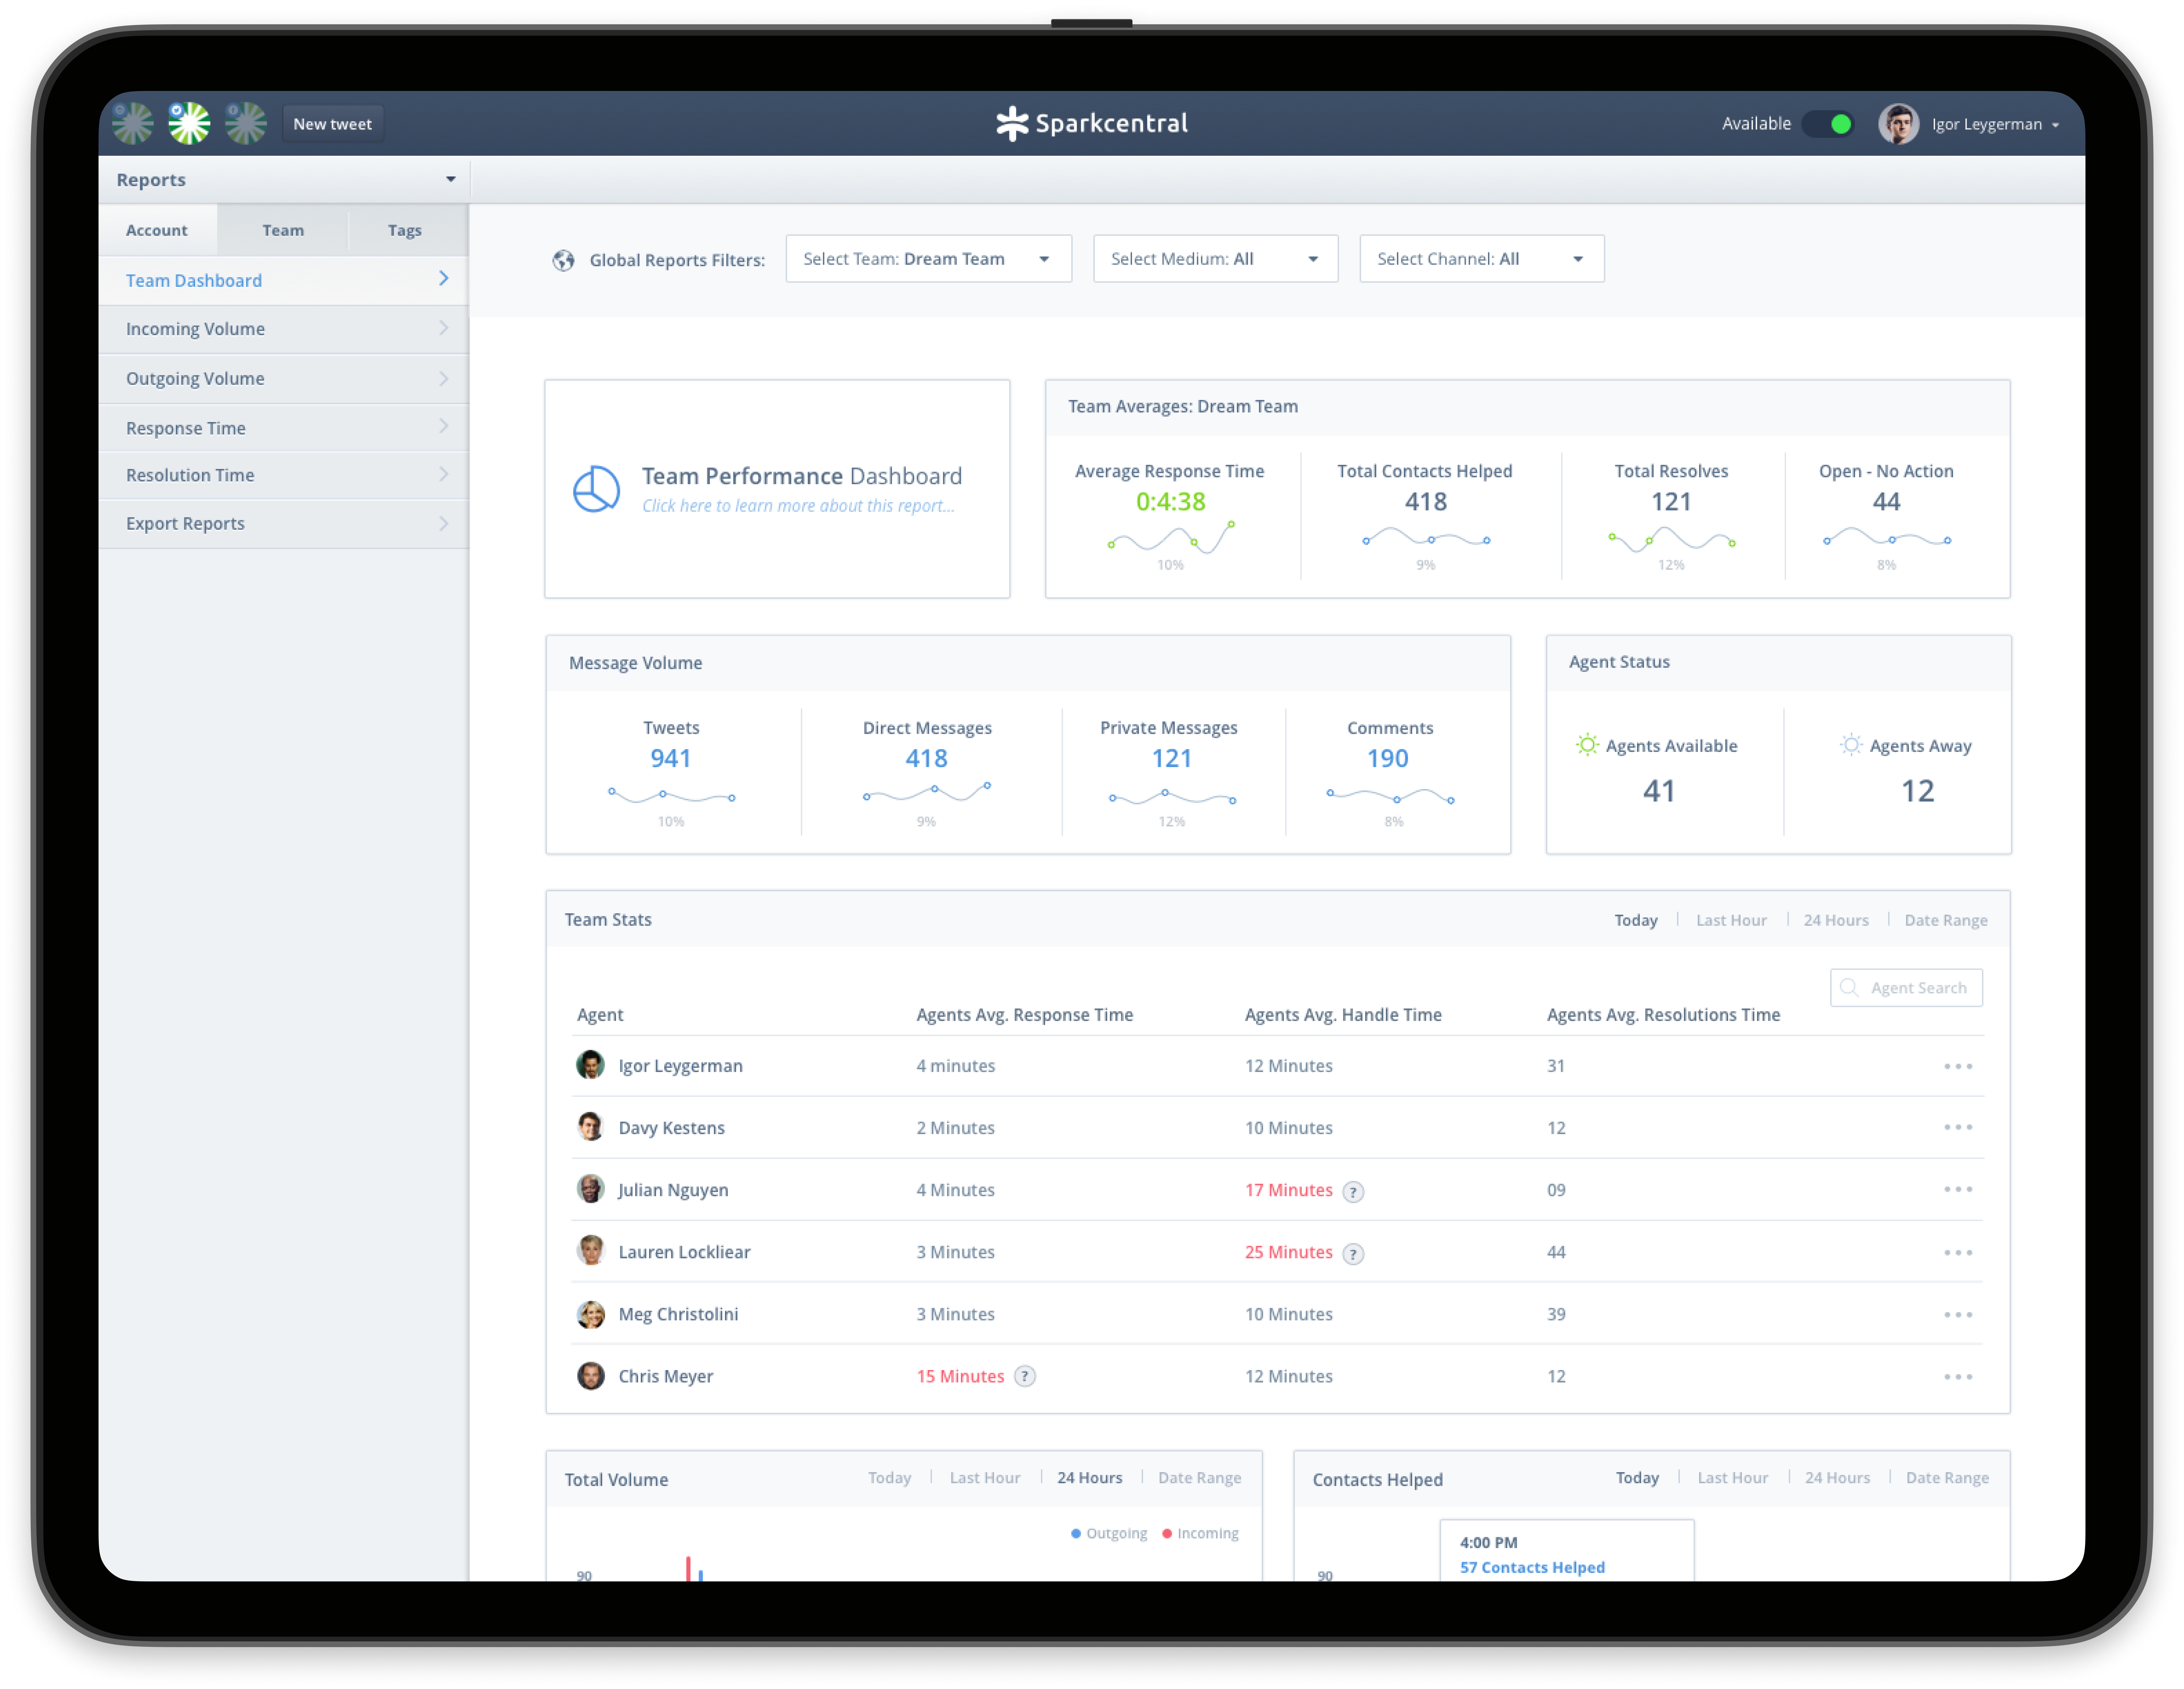
The social media customer support platform empowers businesses to efficiently manage customer interactions across various social media channels. To further enhance the platform's value, there was a need for a comprehensive analytics dashboard to provide support managers with insights into agent performance, team productivity, and customer trends. This case study details the process of designing a new analytics dashboard feature from the ground up.
Problem
Support managers lacked a clear and centralized view of their team's performance on social media. This resulted in several challenges:
Lack of Visibility: Managers had difficulty monitoring agent activity, identifying bottlenecks, and understanding overall team performance.
Inefficient Performance Reviews: Evaluating agent performance was time-consuming and subjective, relying on manual data collection and spreadsheets.
Missed Opportunities: Managers couldn't identify trends or patterns in customer interactions to proactively improve support strategies.
Difficulty in Reporting: Generating reports for stakeholders on support performance and key metrics was a cumbersome process.
Lack of Actionable Insights: xisting reports provided data but lacked actionable insights to drive decision-making and process improvements.

Project Goal
To design an analytics dashboard that empowers support managers to:
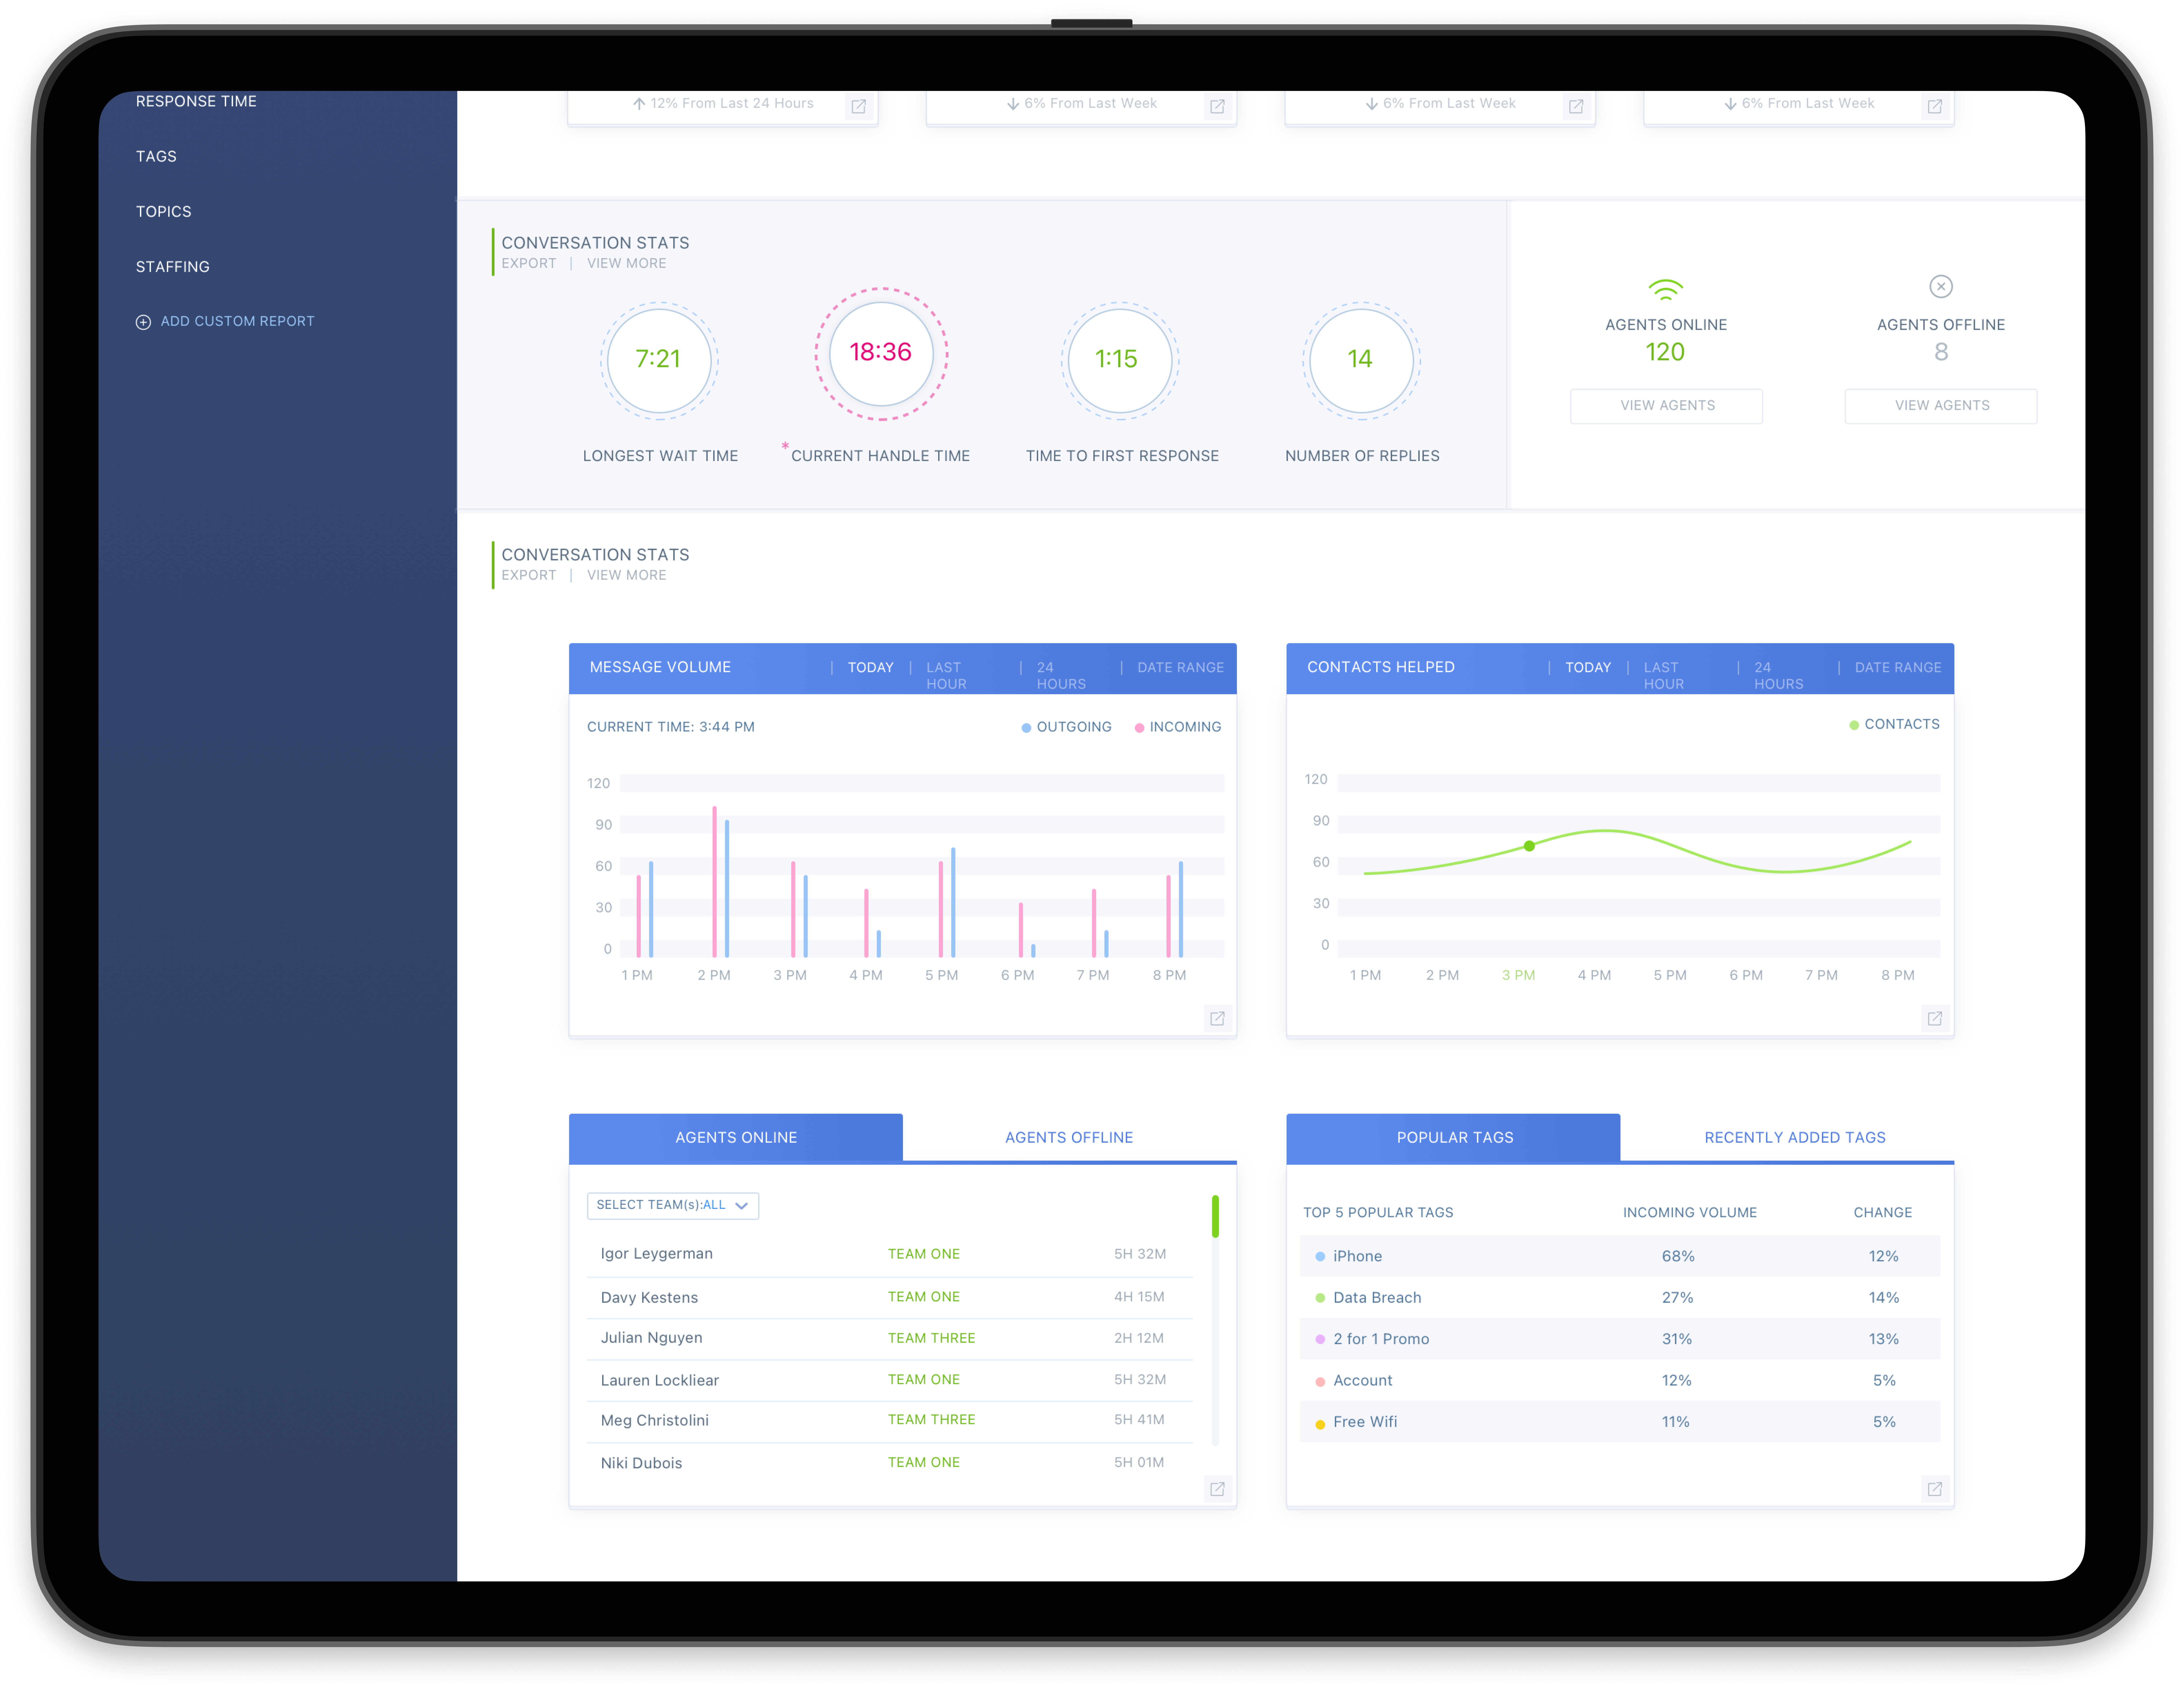
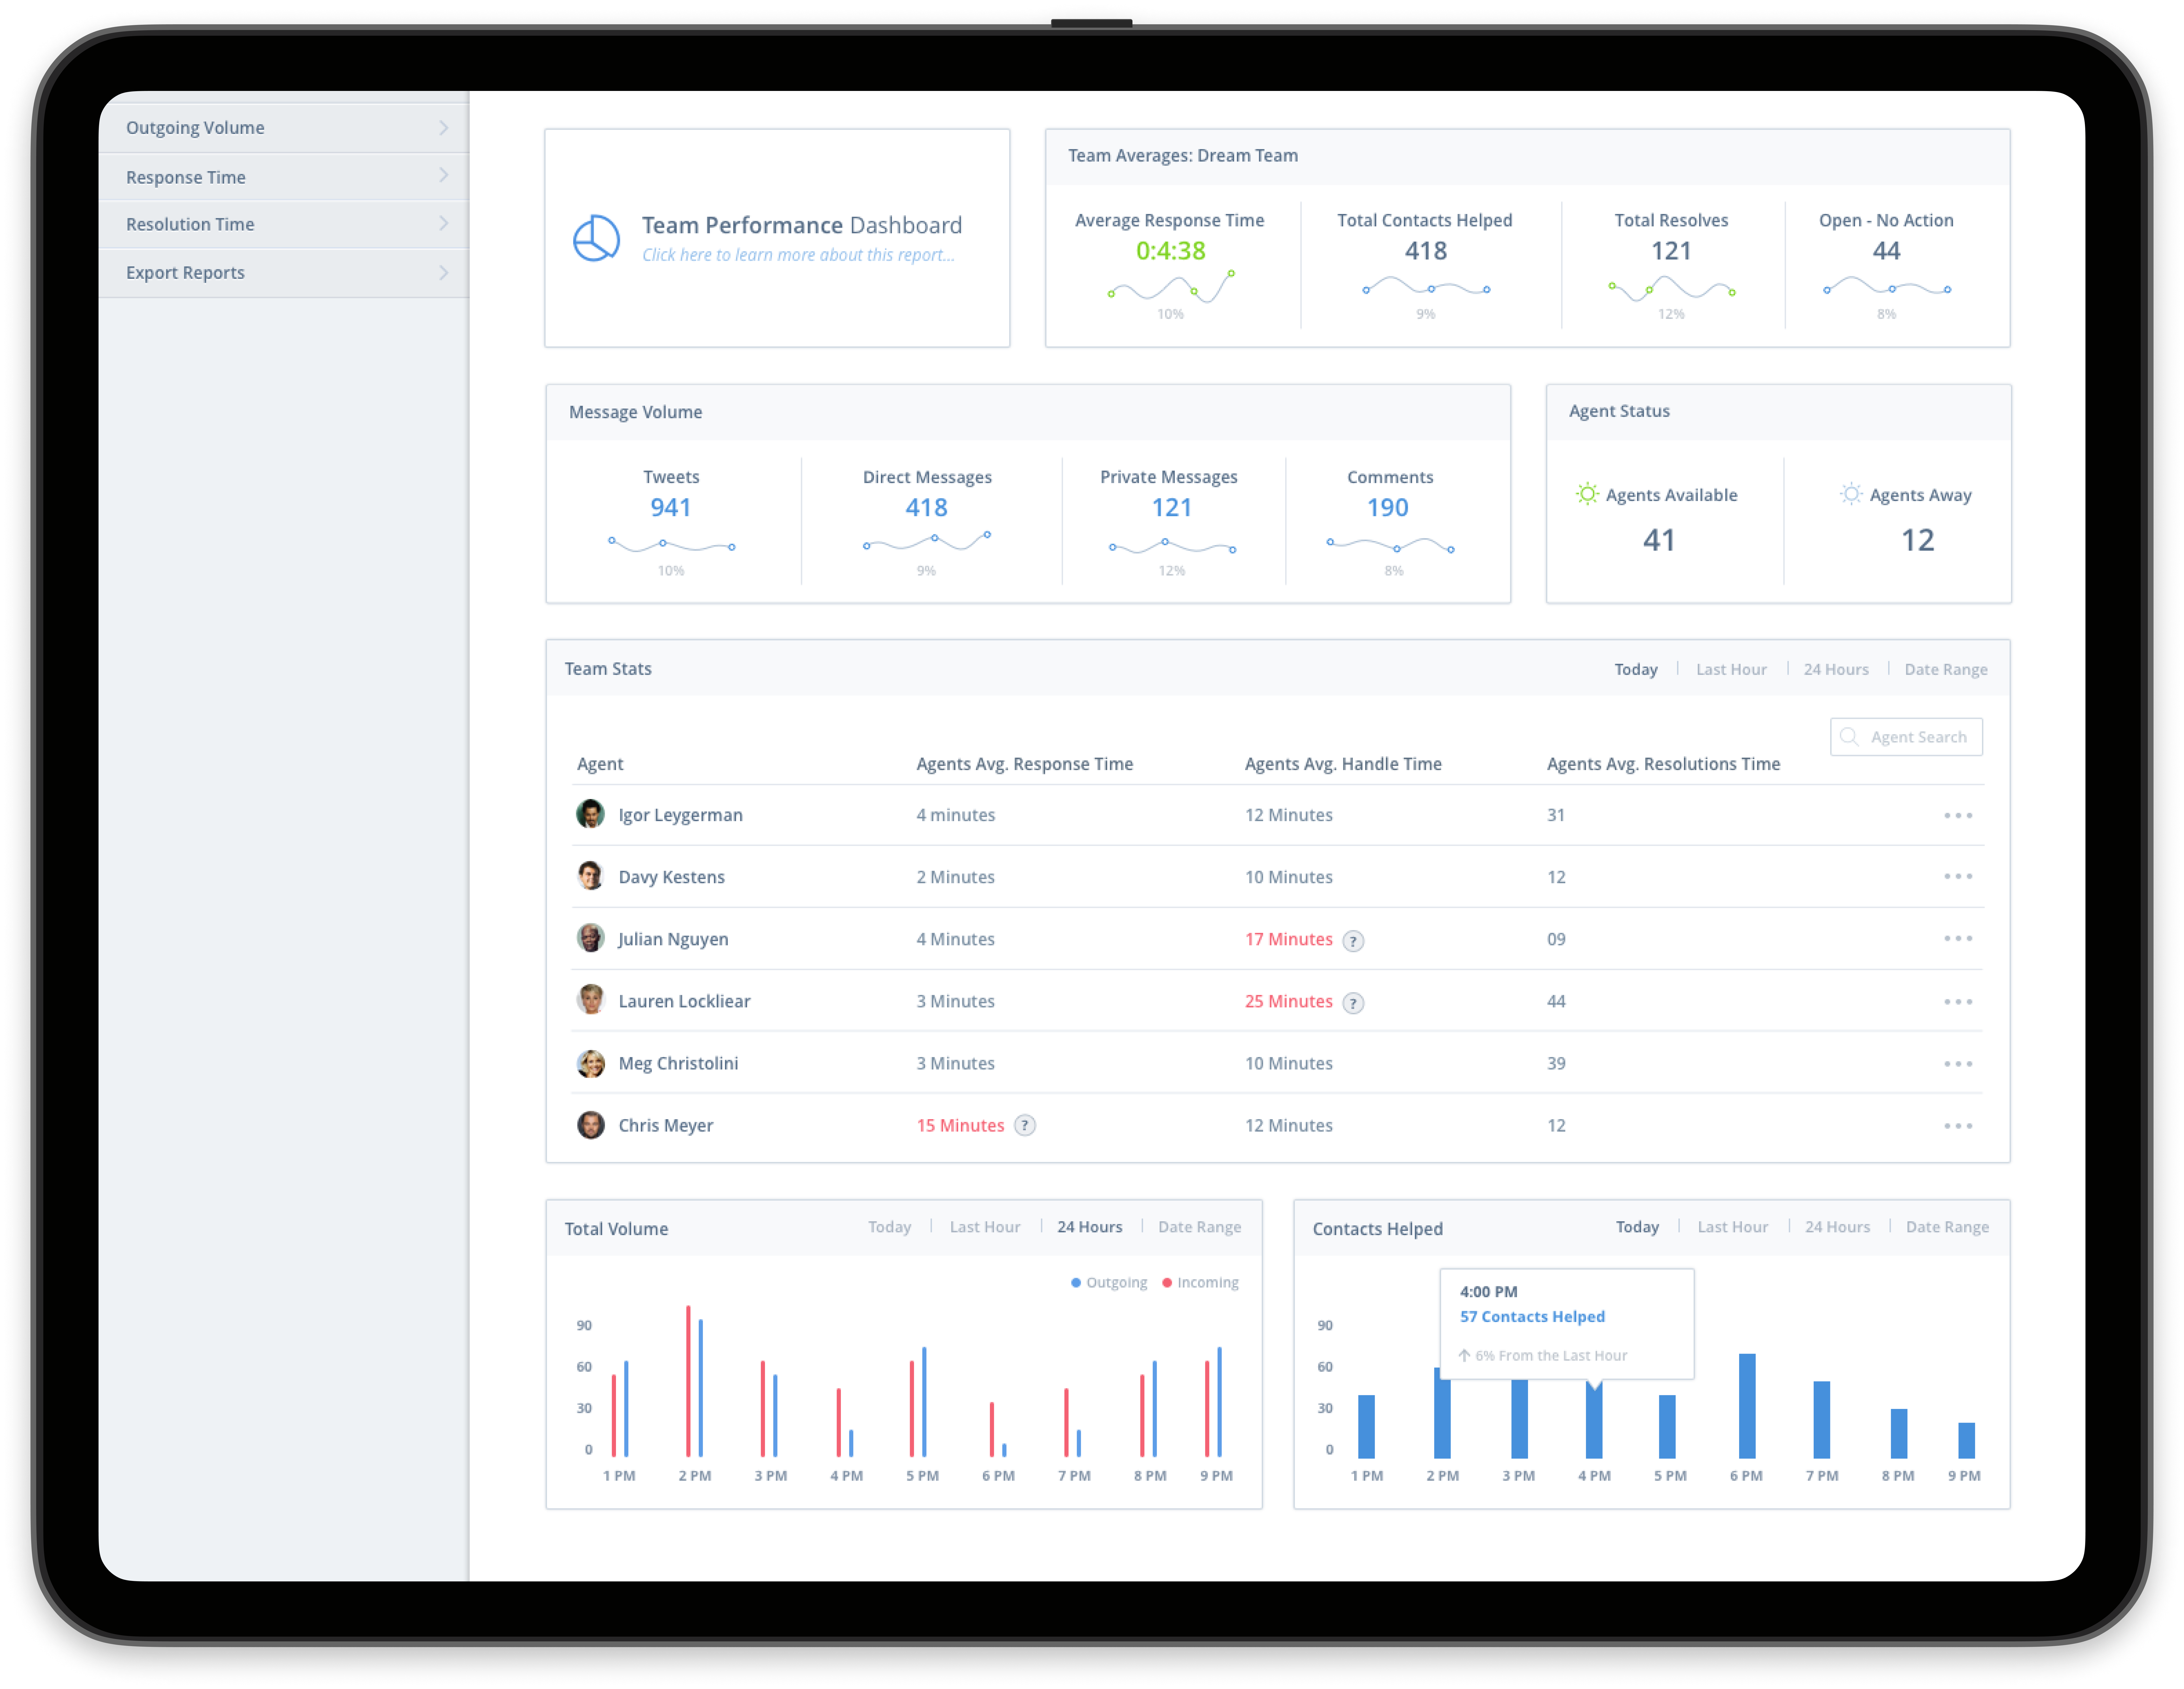
01: Gain a holistic view of agent performance and team productivity.
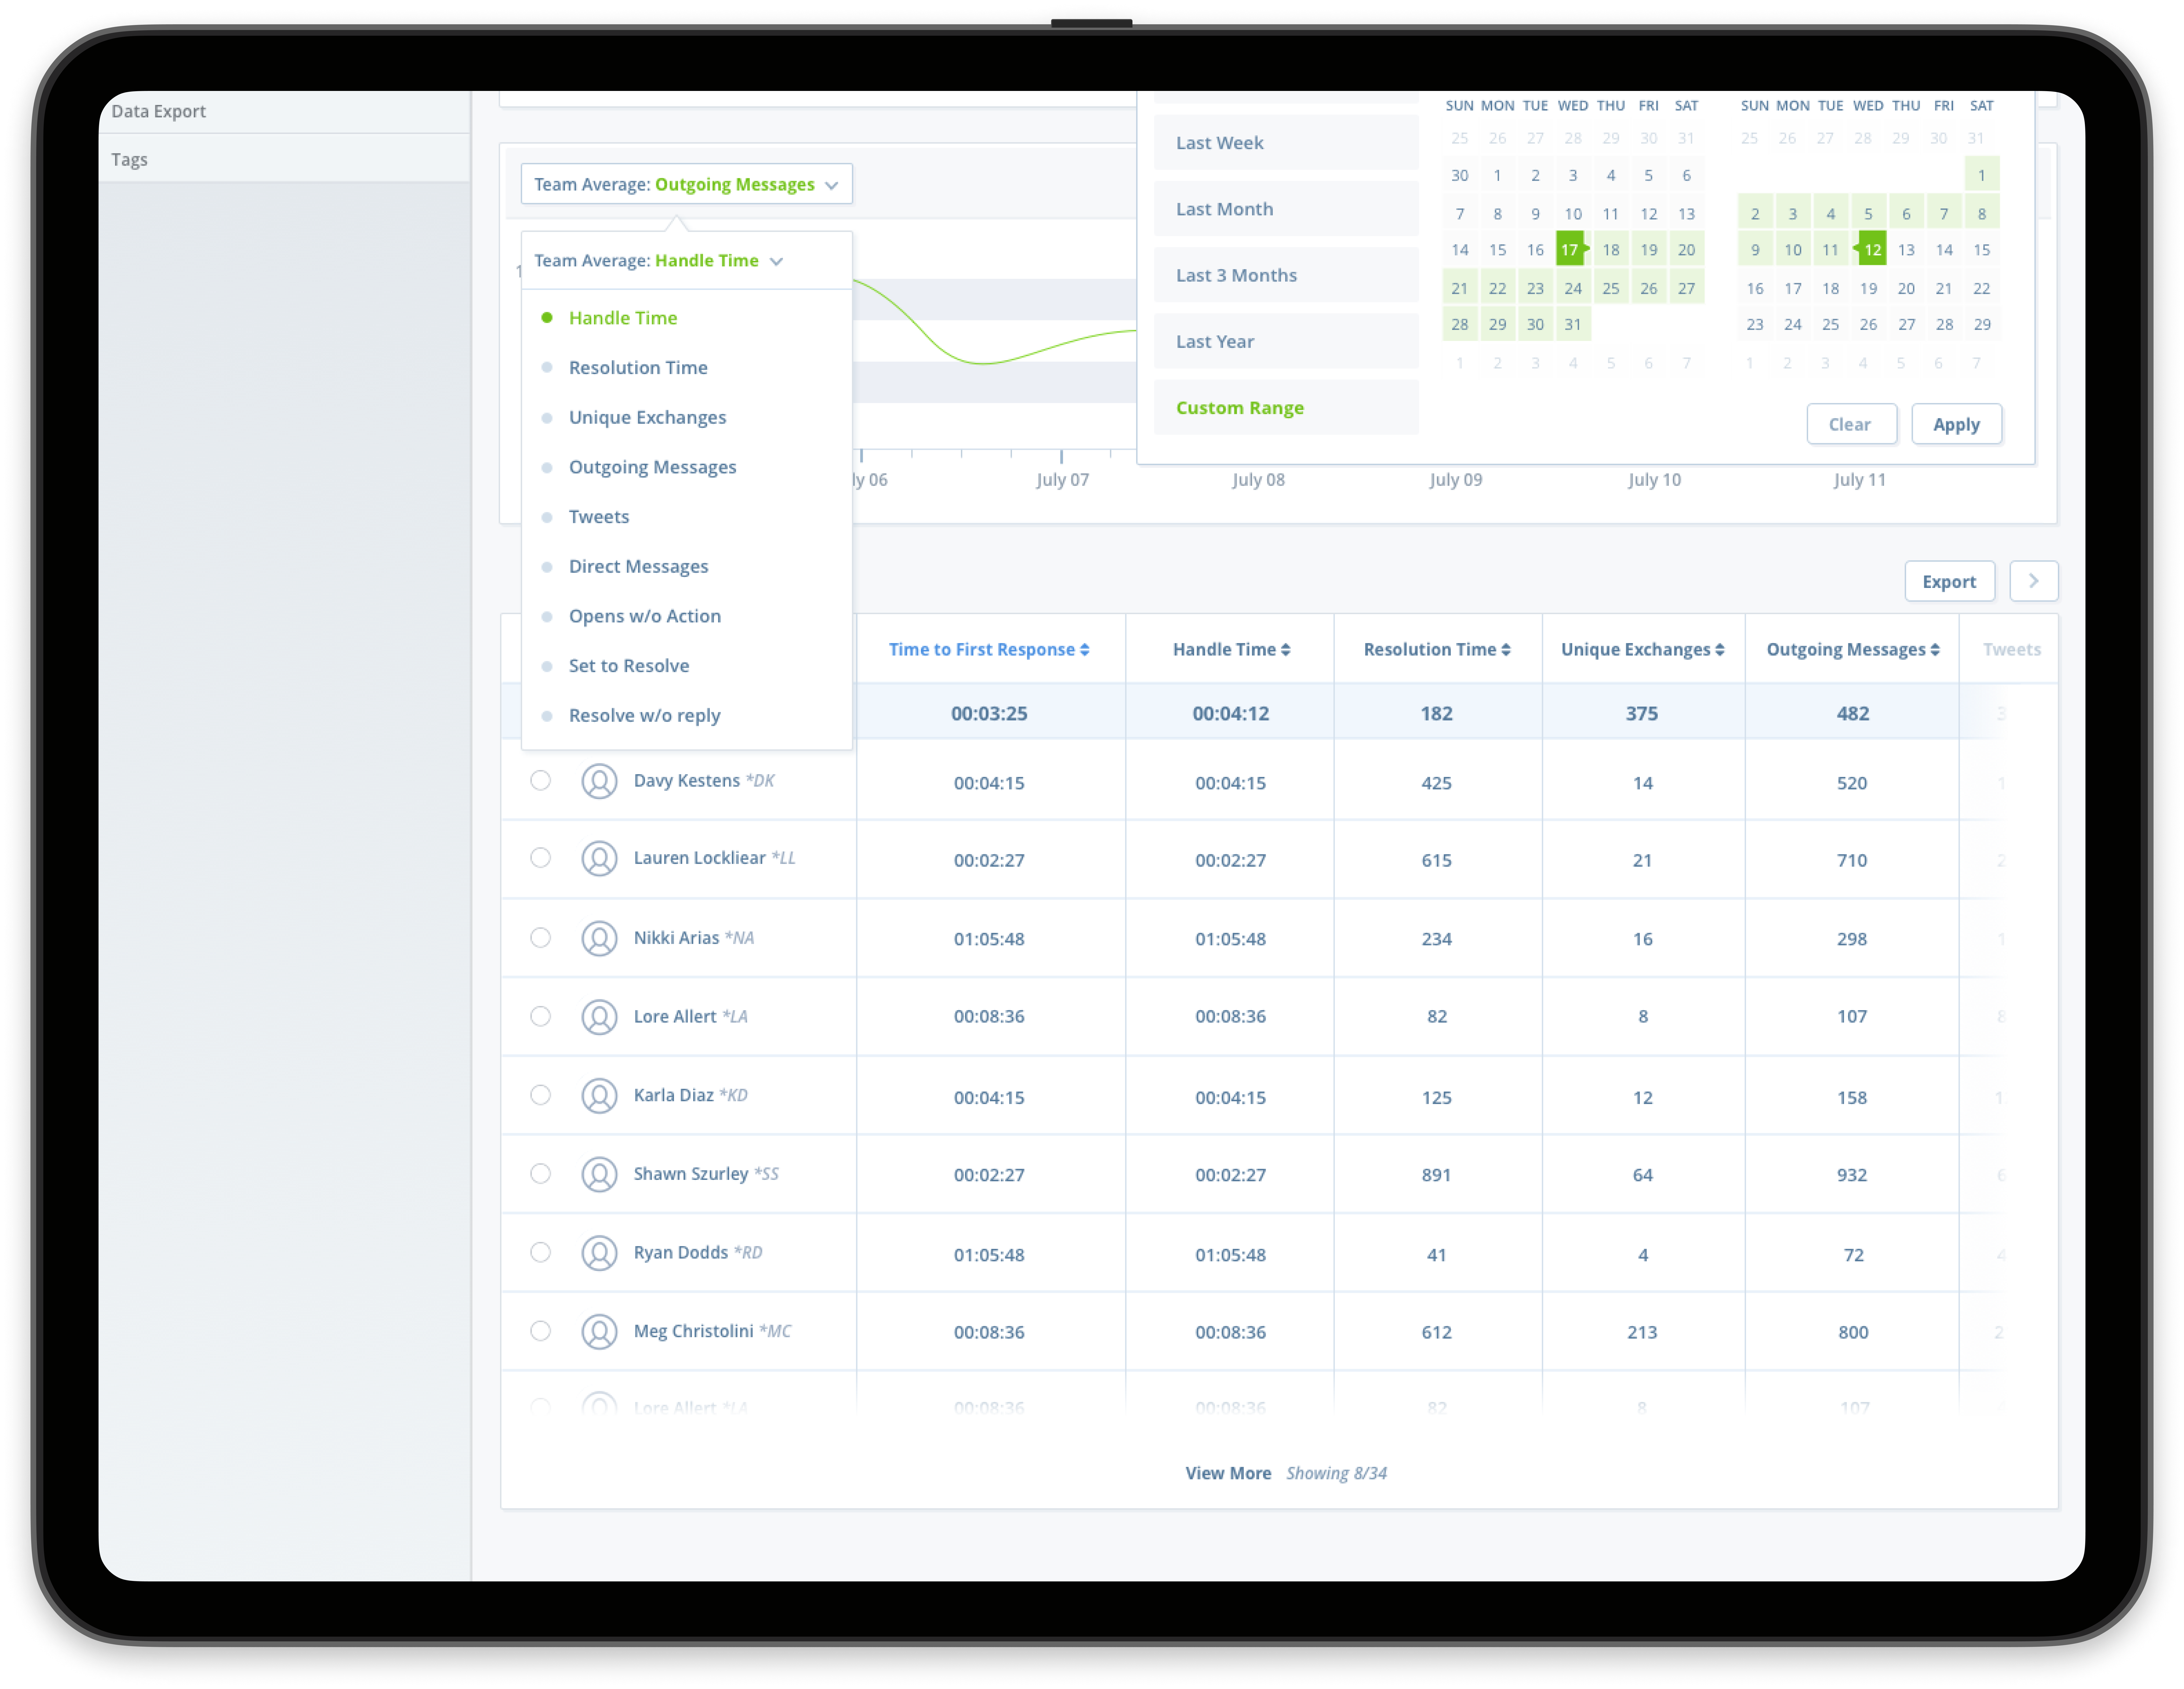
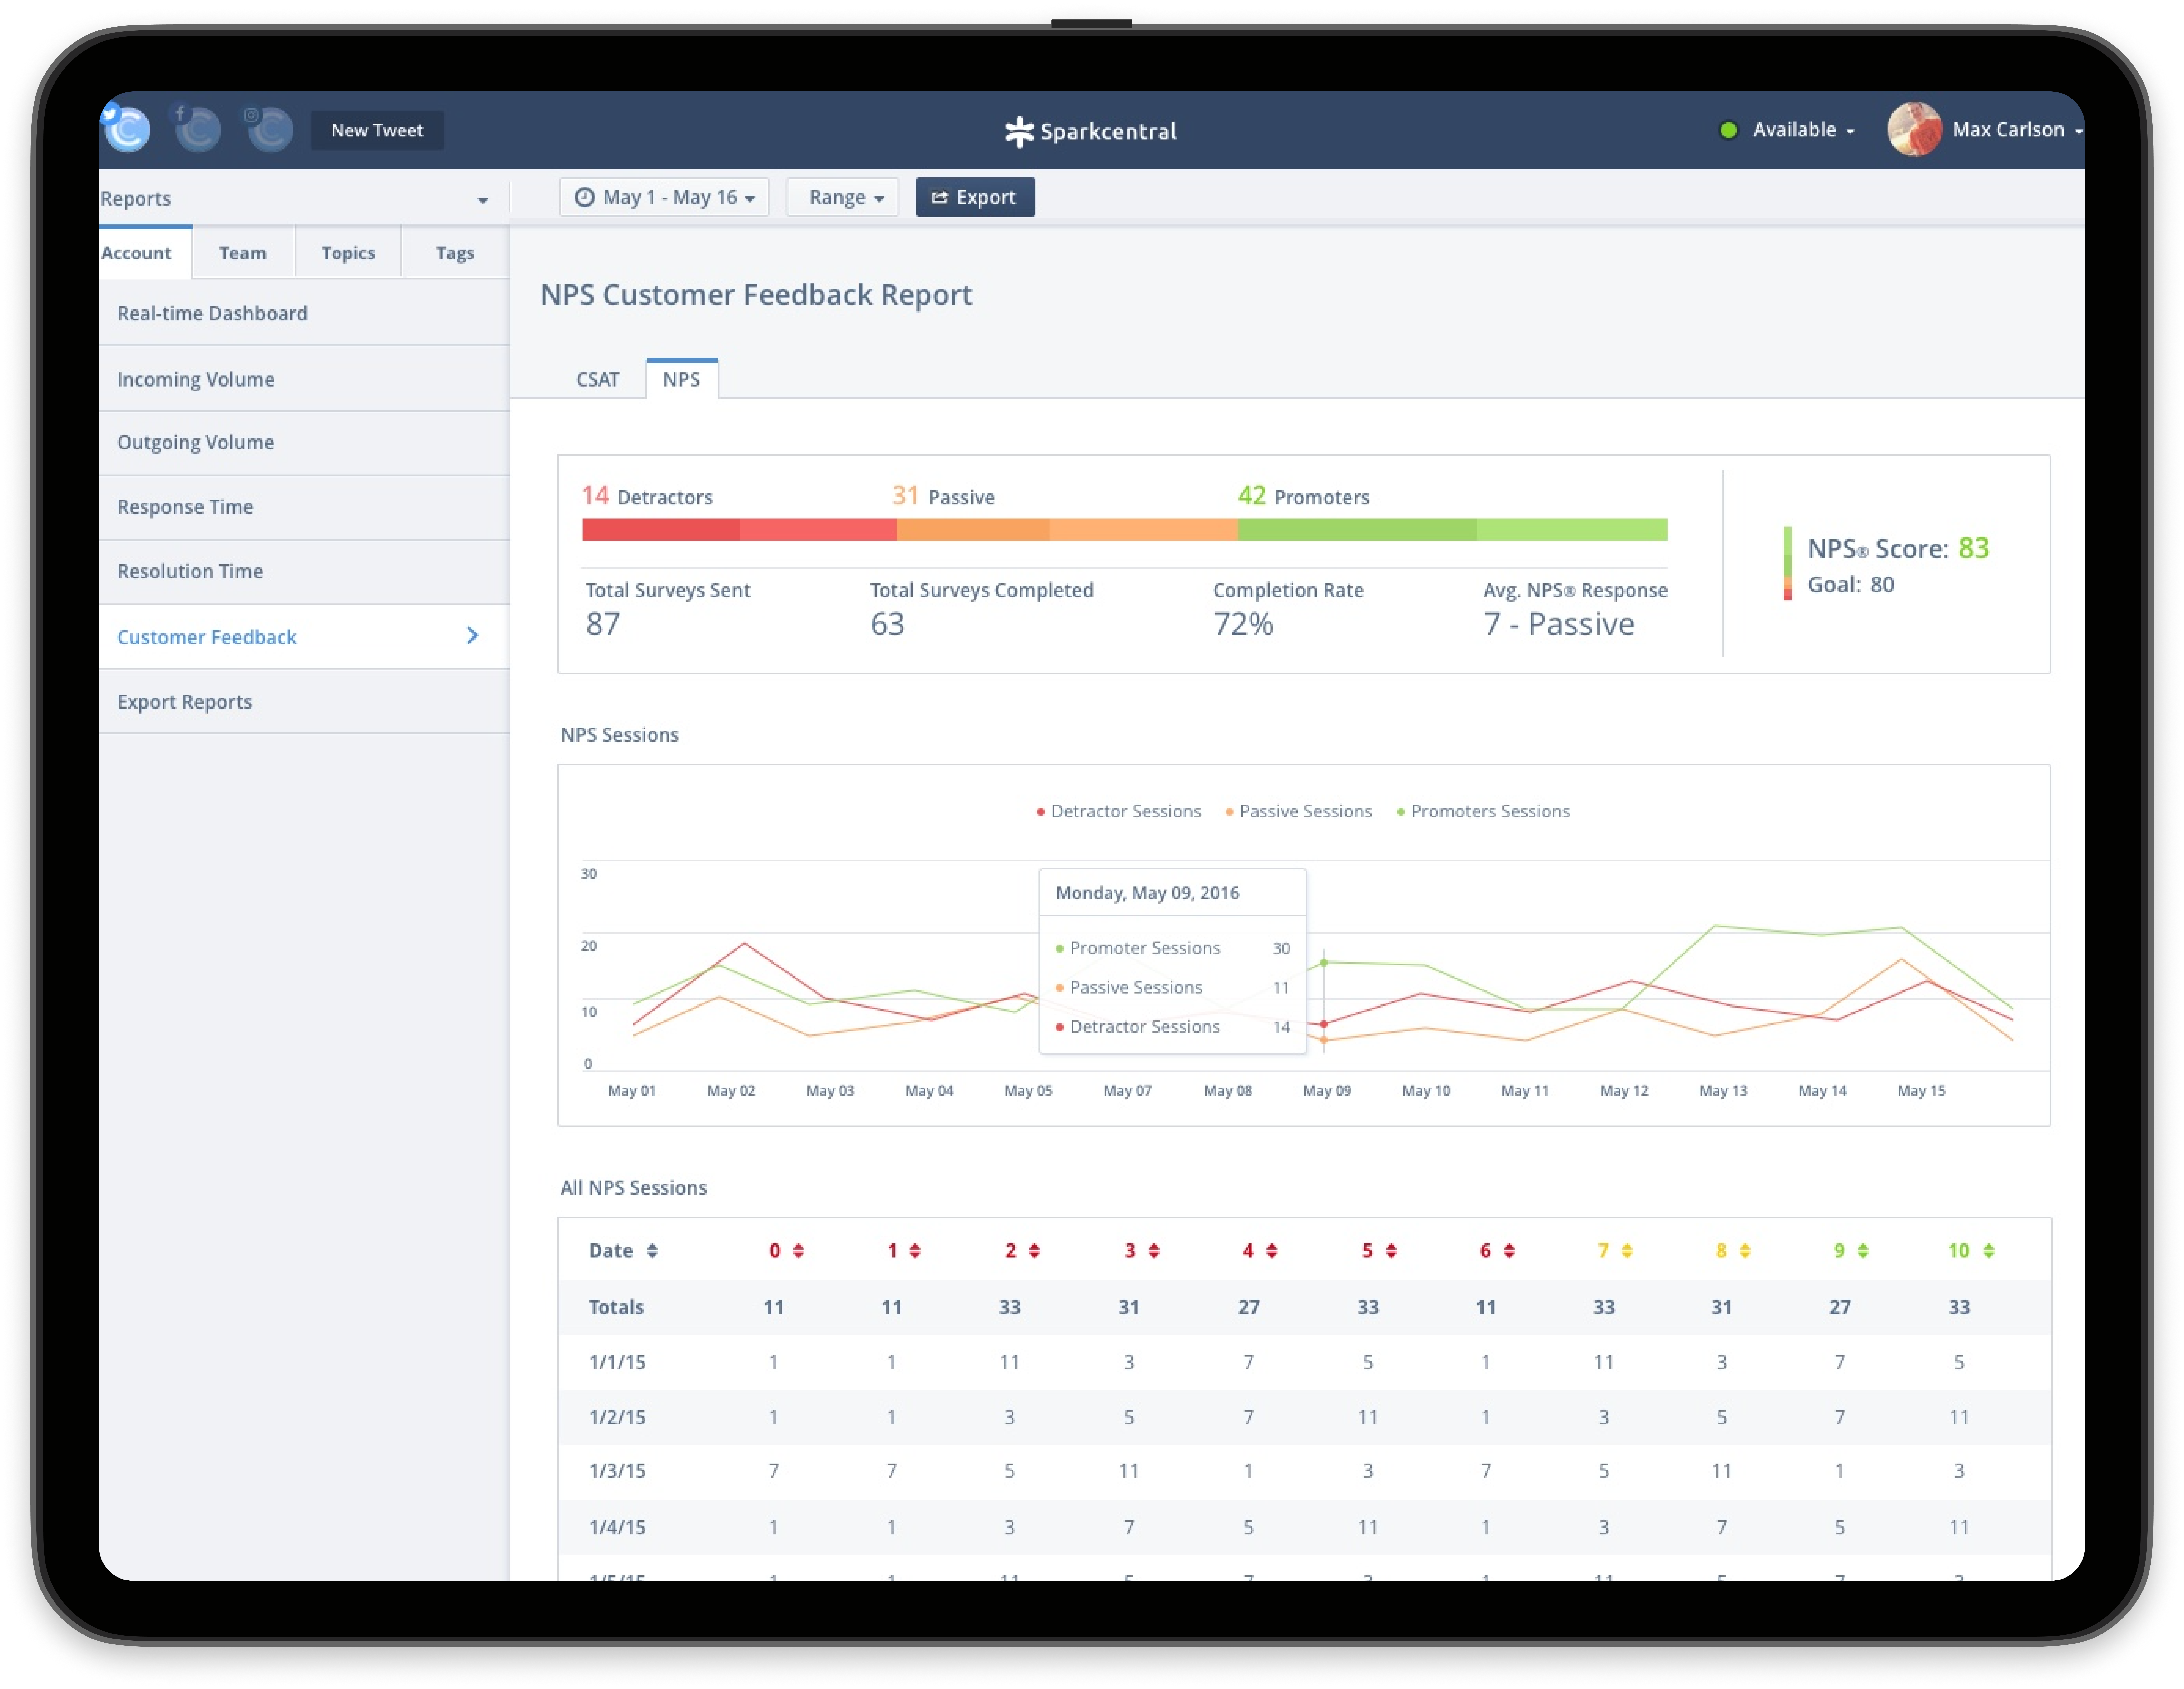
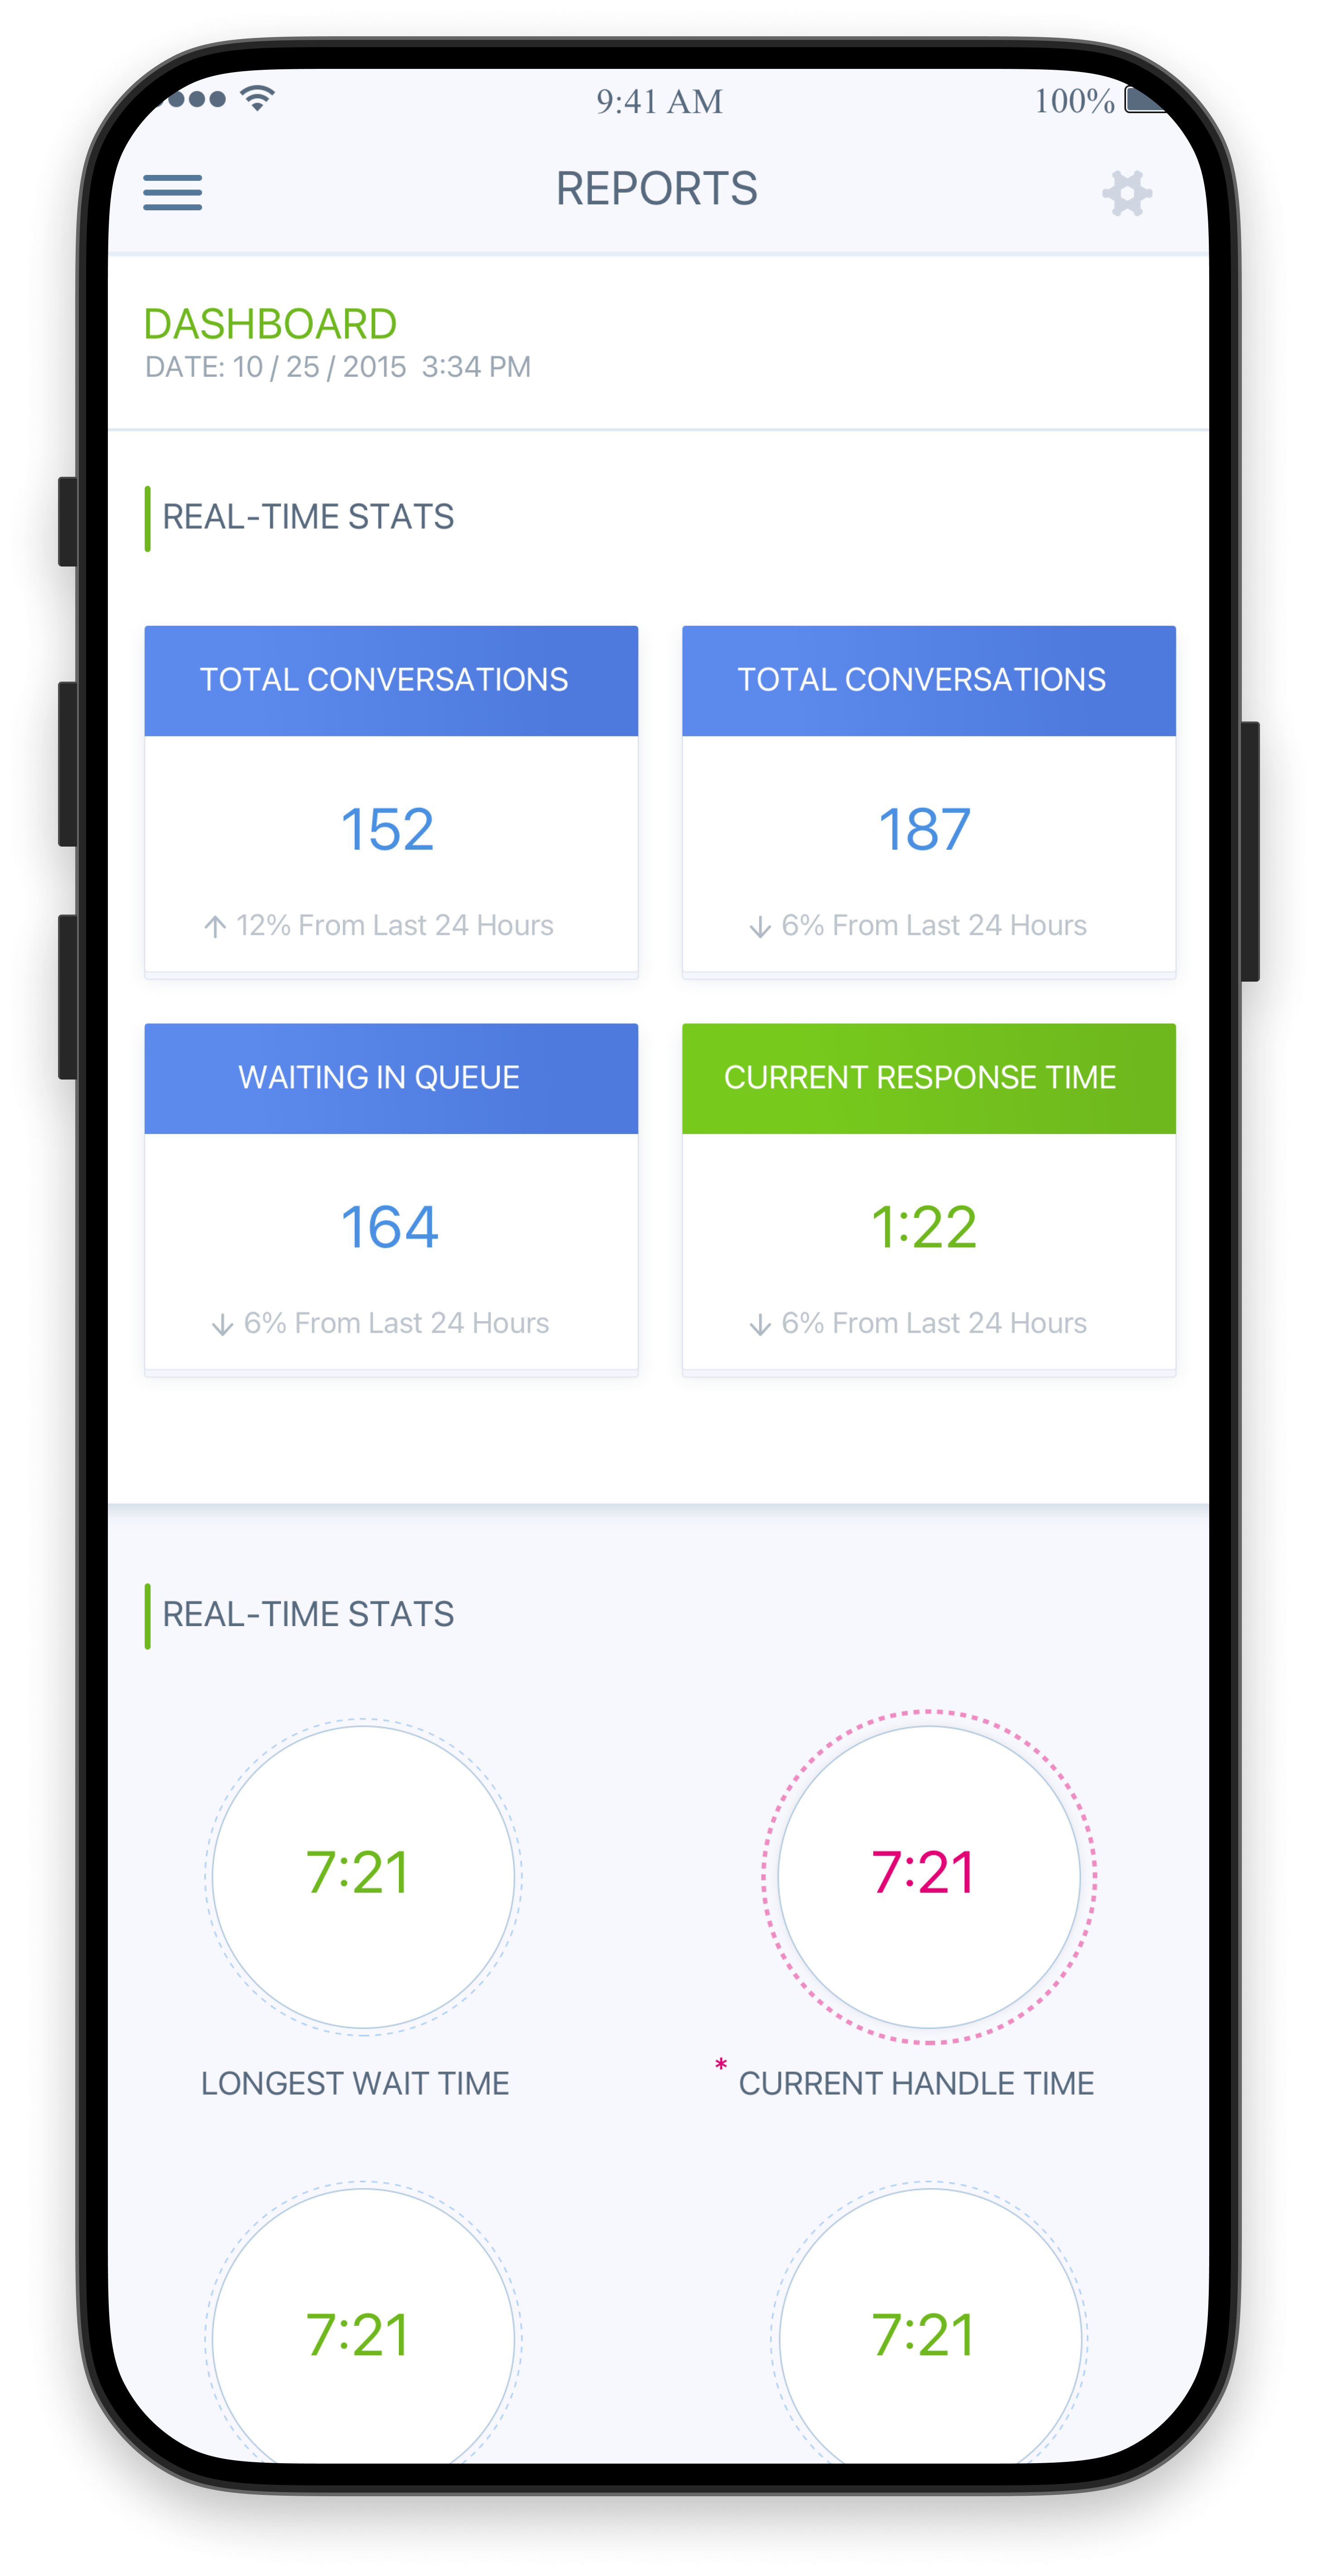
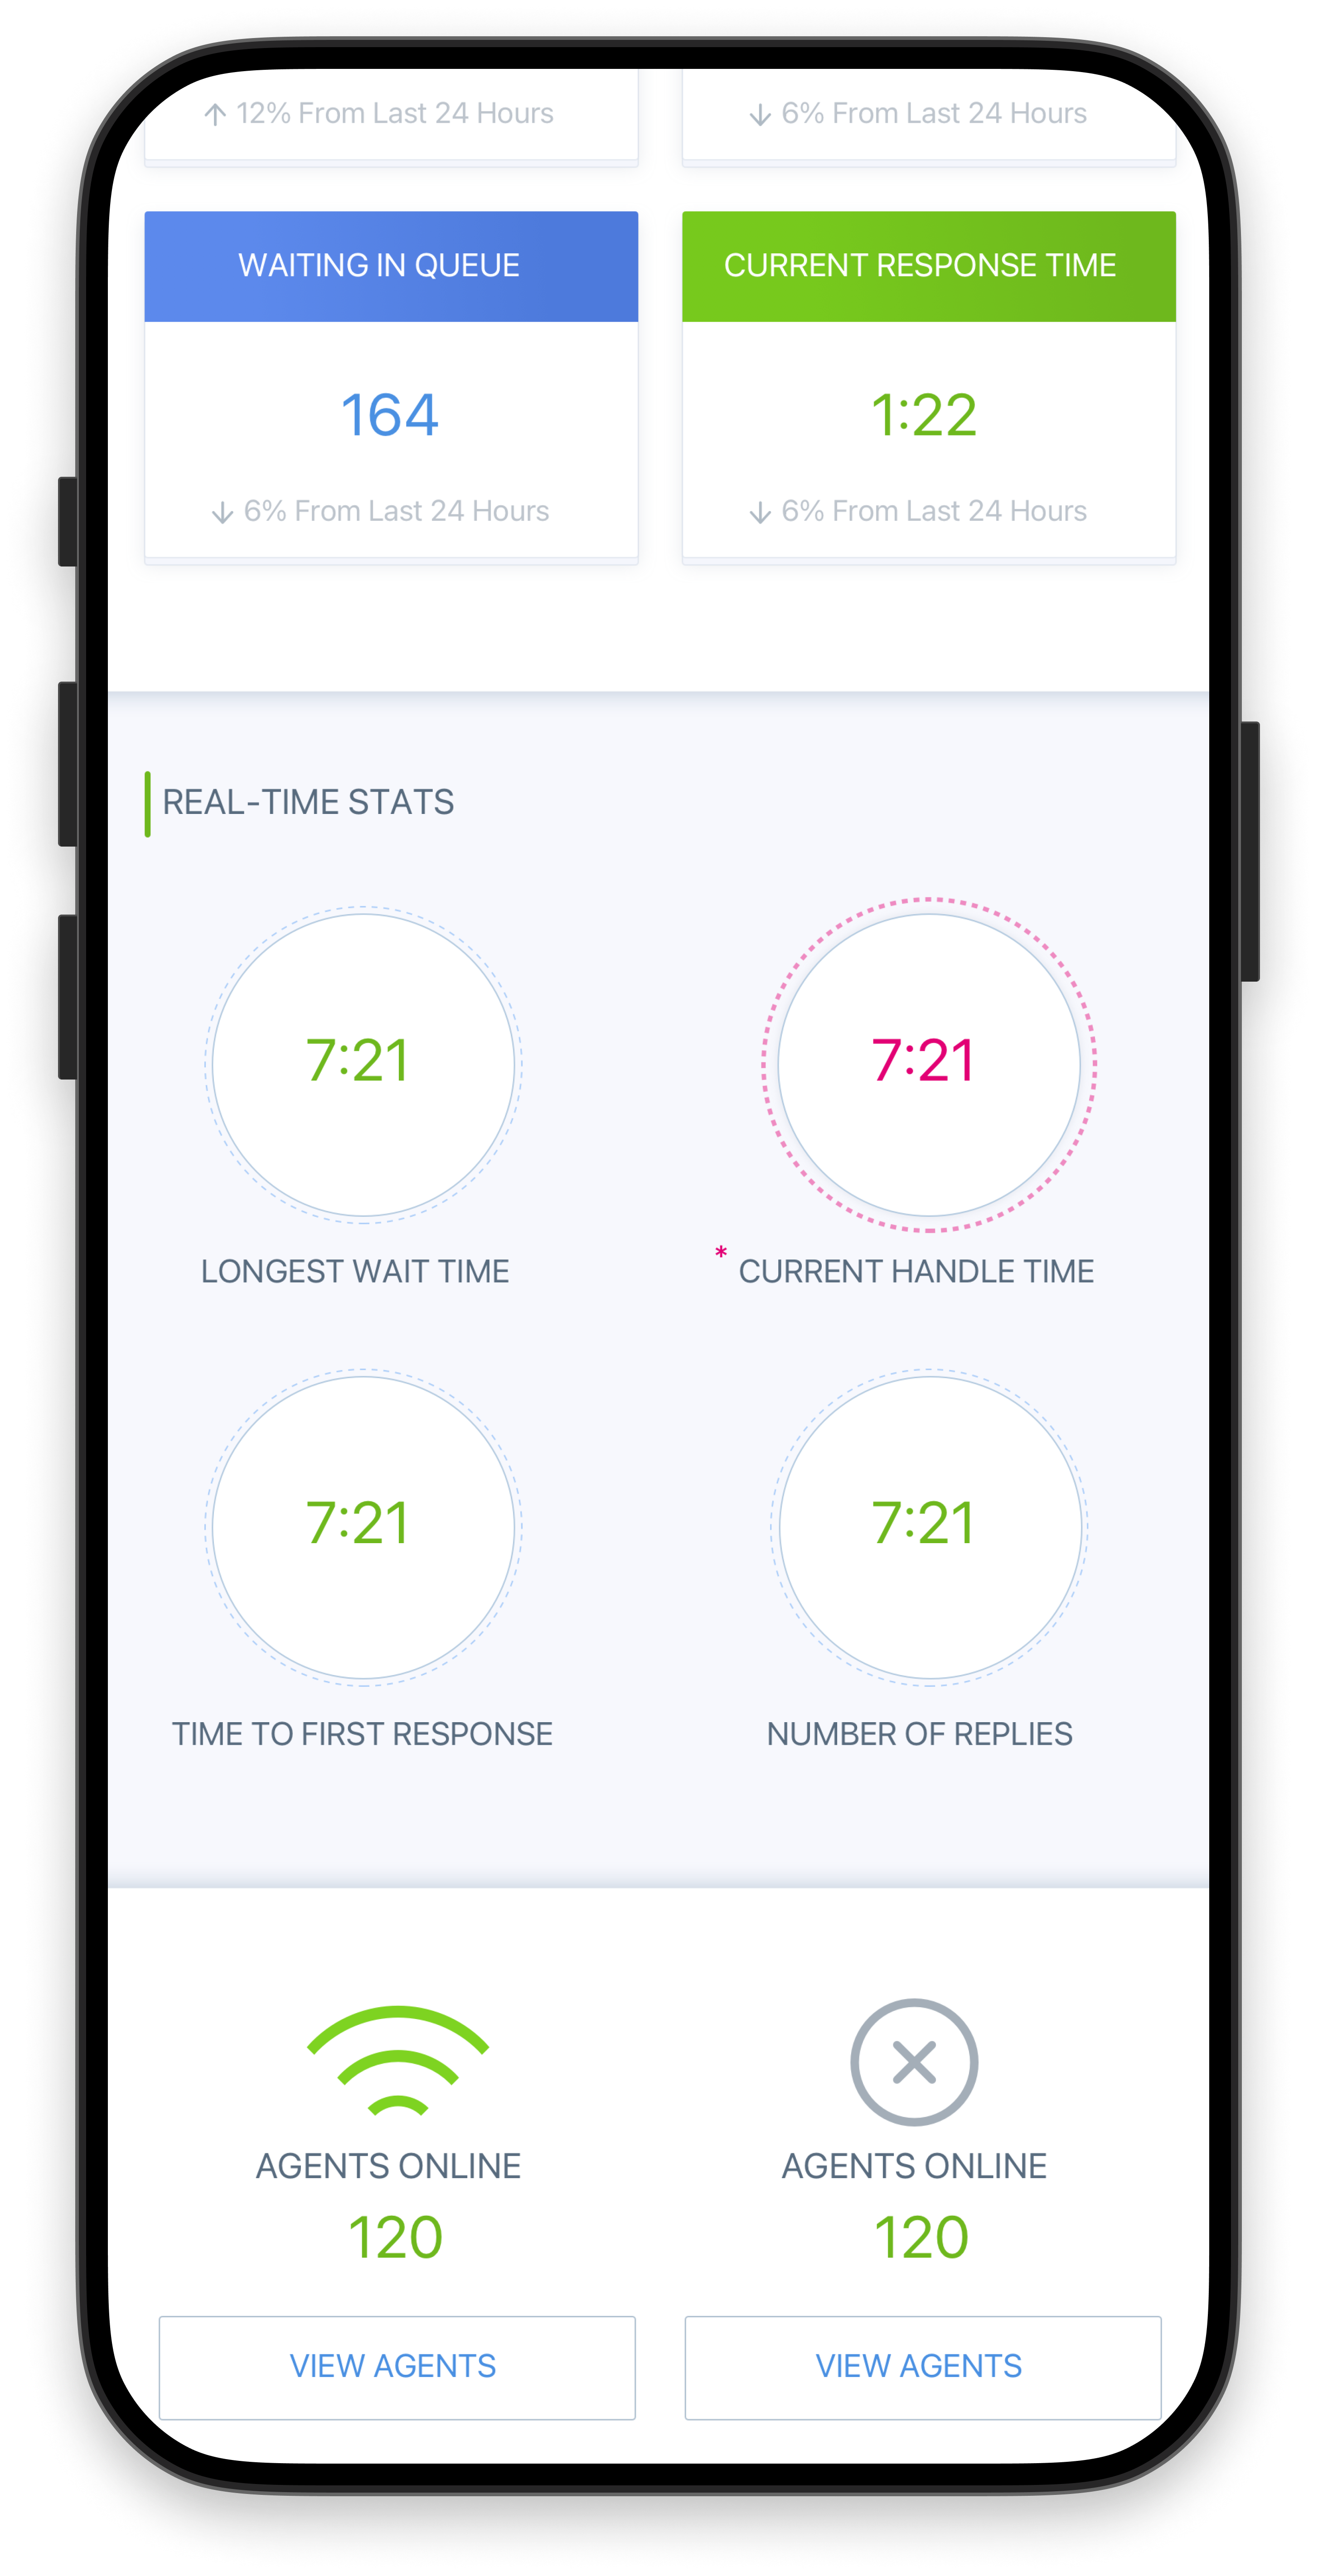
02: Track key metrics related to social media support, such as response time, resolution time, and customer satisfaction.
03: Identify trends and patterns in customer interactions to improve support strategies.
04: Generate customizable reports for stakeholders.
05: Drive data-driven decisions and improve overall support operations.
Responsibilities
To design an analytics dashboard that empowers support managers to:
Discovery and Research: - Conducted user interviews with support managers to understand their needs, pain points, and goals in measuring and analyzing team performance. - Analyzed existing reports and analytics tools used by support teams to identify best practices and gaps. - Collaborated with data analysts to identify key metrics and data sources relevant to social media support performance.
Definition and Planning: - Worked with product managers to define the scope of the dashboard, identify target users, and prioritize features. - Established key performance indicators (KPIs) to measure the success of the dashboard, such as user engagement, report generation frequency, and impact on decision-making. - Created user personas to represent different types of support managers and their specific needs.
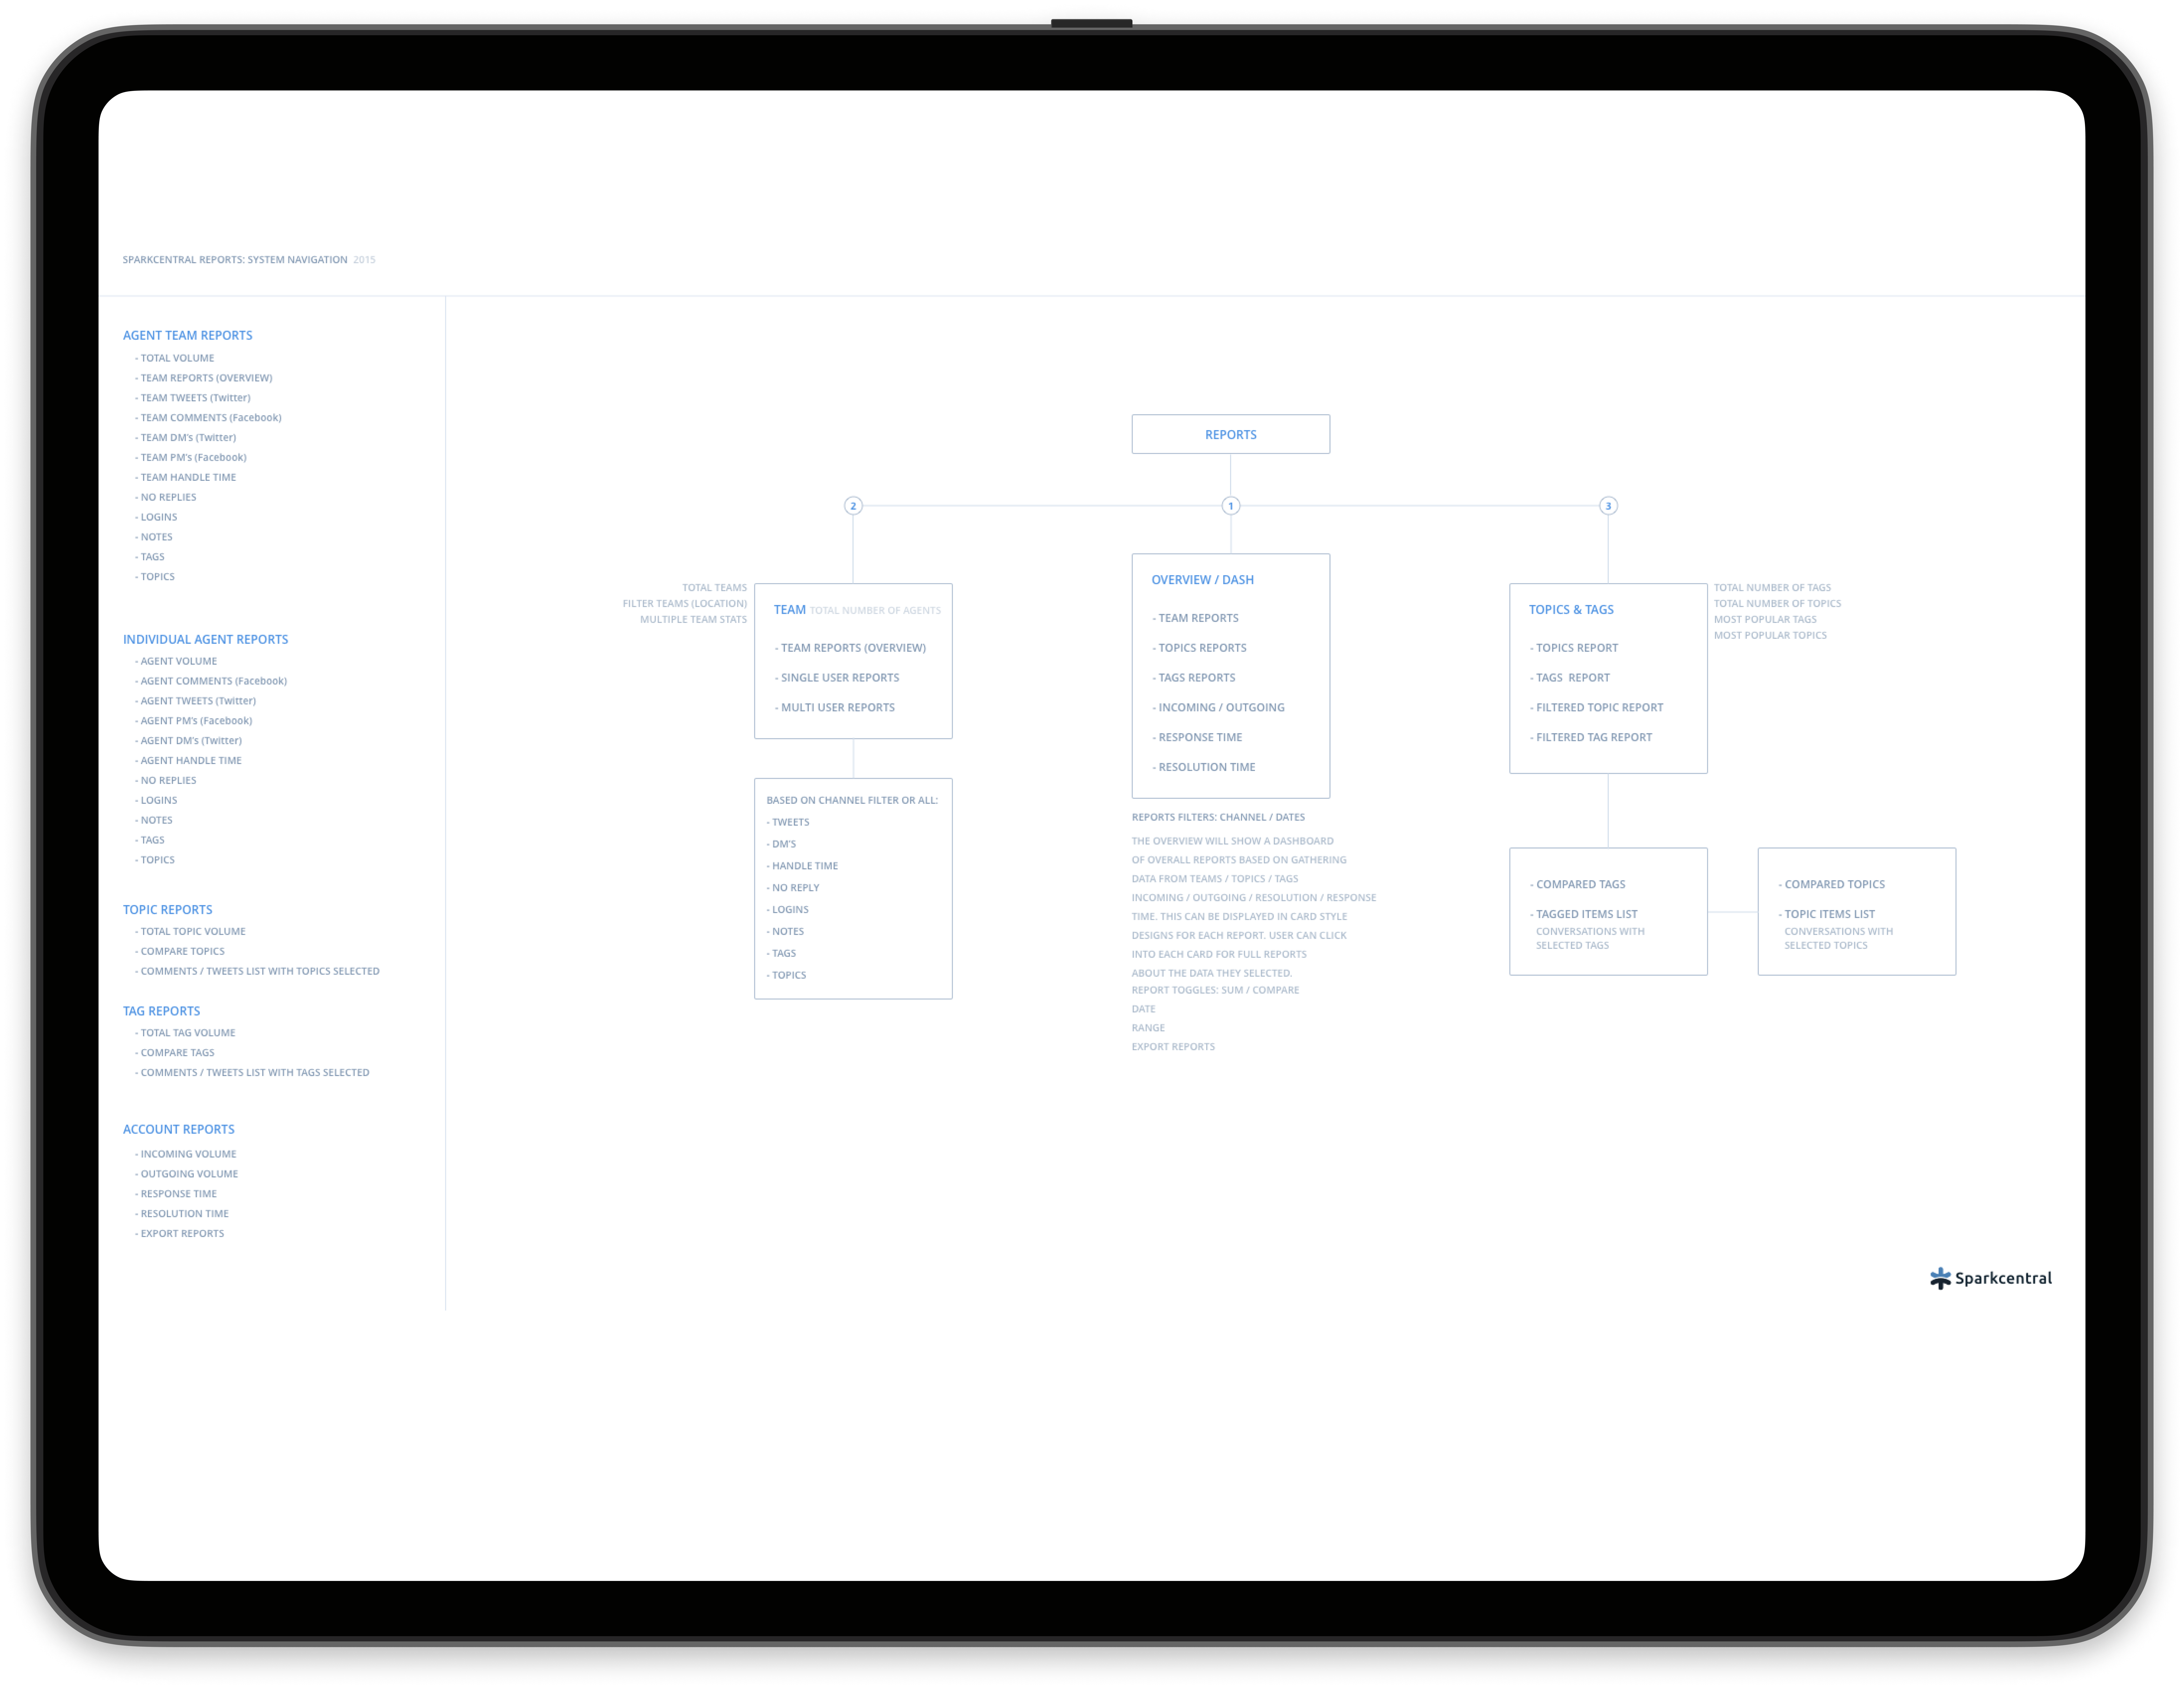
Information Architecture and User Flows: - Defined the information architecture of the dashboard, including the organization of data, navigation structure, and filtering options. - Designed user flows to illustrate how support managers would access and interact with the dashboard, such as viewing performance summaries, drilling down into specific metrics, and generating custom reports.
Wireframing and Prototyping: - Created low-fidelity wireframes to explore different layout options, data visualizations, and dashboard interactions. - Developed high-fidelity prototypes using tools like Figma to simulate the user experience and test design concepts.
UI Design: - Designed the visual interface of the dashboard, including the color palette, typography, and data visualization styles, ensuring a clear, modern, and professional aesthetic. - Created a design system for dashboard components to ensure consistency and scalability.
Usability Testing: - Conducted usability testing sessions with support managers to gather feedback on the dashboard design and identify areas for improvement. - Iterated on the design based on user feedback, making adjustments to the layout, data visualizations, and user interactions.
Development and Handoff: - Collaborated closely with the engineering team to ensure the design was implemented accurately and efficiently. - Provided design specifications, assets, and guidelines to the development team. - Participated in design reviews and provided feedback during the development process.
Launch and Iteration: - Monitored user feedback and analytics after launch to track usage patterns, identify pain points, and plan for future iterations. - Gathered feedback through surveys, in-app feedback forms, and user interviews. - Prioritized ongoing design improvements based on user feedback and performance data.
Outcomes
The project resulted in the successful launch of an analytics dashboard that provides support managers with valuable insights into team performance and customer trends. Specific outcomes included:
01: Improved visibility into agent performance and team productivity.
02: Increased efficiency in performance reviews and reporting.
03: Identification of key trends and opportunities to improve support strategies.
04: Empowered support managers to make data-driven decisions.
05: Enhanced overall support operations and customer satisfaction.